 DataViz Weekly is here to meet you with several new interesting data visuals and stories based on them that have come to light just recently. Look what we are happy to feature this time:
- how the United States uses its land;
- company size vs. pay;
- education deserts in America;
- popularity of programming languages.
Data Visualization Weekly: July 27, 2018 — August 3, 2018
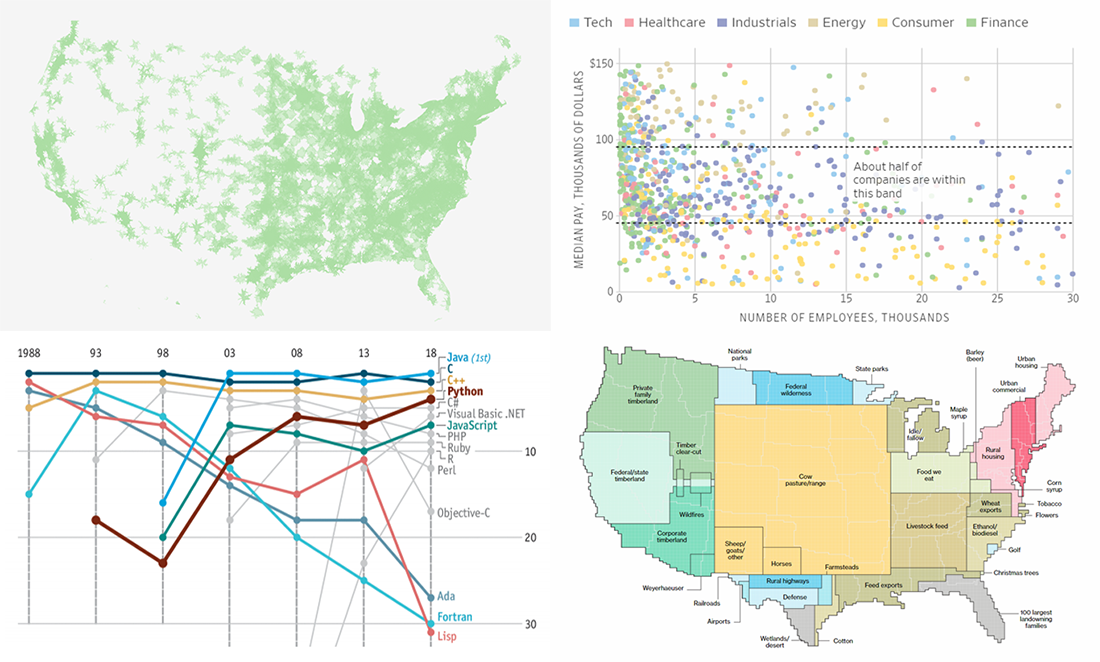
How U.S. Uses Its Land
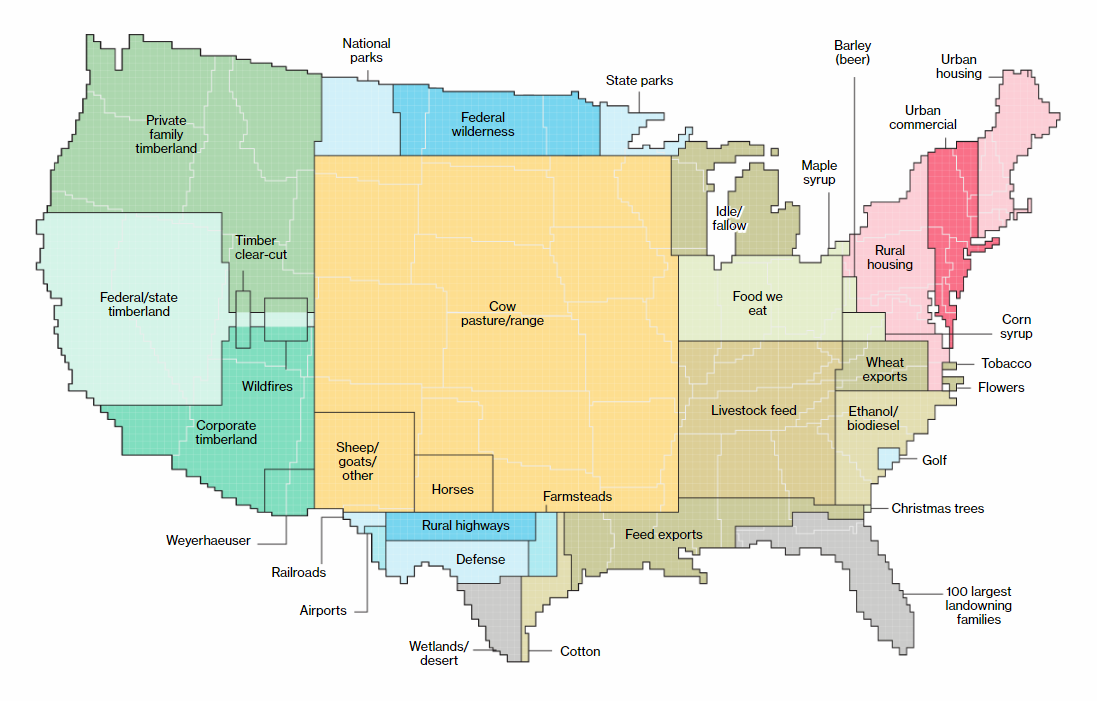
Dave Merrill and Lauren Leatherby from Bloomberg made a nice visual story to explain how land in the United States of America is actually used. Here you can see not only how pasture, forest, cropland, urban, as well as special- and miscellaneous-use types of land are distributed across the country. It is especially interesting to look at the data pieced together in order to compare total acreage estimates across categories and have states (and their size) as a point of reference.
Company Size vs. Pay
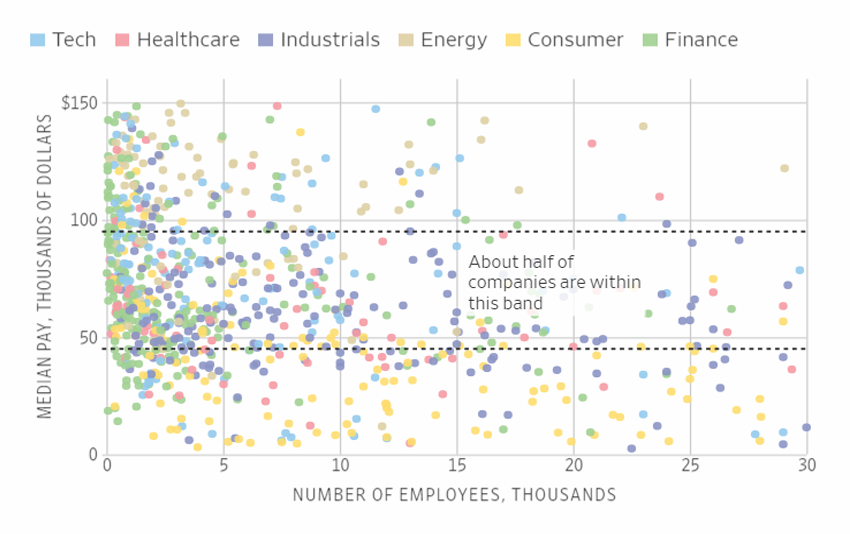
The Wall Street Journal analyzed data about more than a thousand U.S. companies to see if their size and median pay correlate. Look at this new study with cool marker charts on the WSJ for details on how companies, small and large, pay their employees.
Education Deserts in U.S.
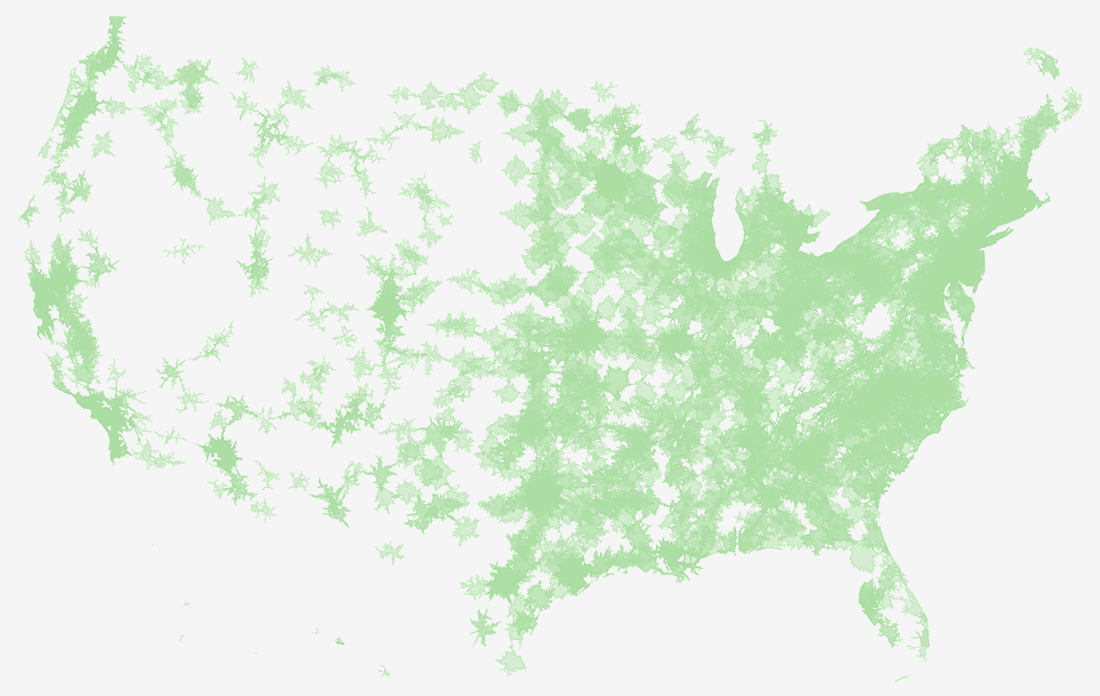
The Chronicle of Higher Education found out that more than 11 million adults in the United States — it’s 3.5% of all the American adults — live in so-called education deserts without a public college within driving distance. Check out their analysis accompanied by maps and charts, and learn more about where education deserts are located and who lives in those areas.
Popularity of Programming Languages
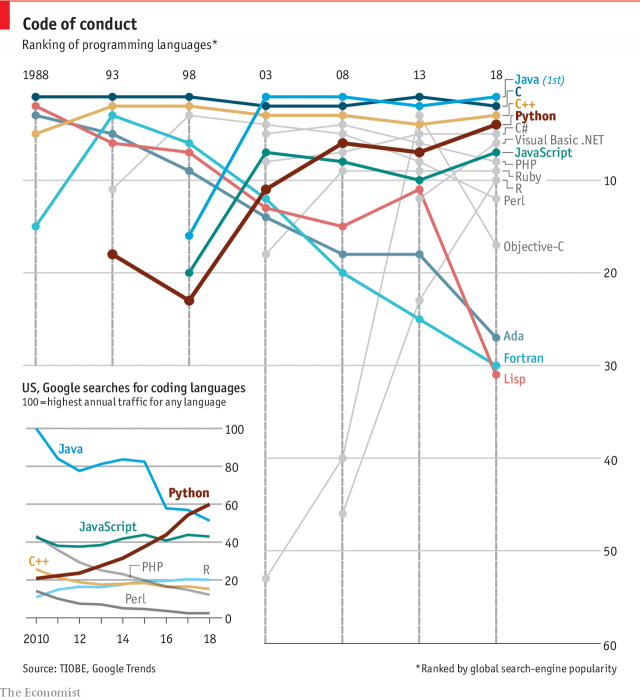
The Economist charted the global (and U.S.-wide) search-engine popularity of programming languages: Java, C, C++, C#, JavaScript, Python, Visual Basic .NET, PHP, Ruby, R, Perl, Objective-C, Ada, Fortran, and Lisp. Look how their rankings have changed over time. In particular, it’s worth noting the growing popularity of Python among professional developers both in the United States and around the globe.
***
For more cool charts and infographics, follow us on Twitter where we share interesting data visuals every day. Let us know if you’ve come across something worthy of being featured in our feed and included in Data Visualization Weekly next time.
Have a great weekend time!
- Categories: Data Visualization Weekly
- 1 Comment »