 Not only is the AnyChart JS Charts blog a go-to place for our news and tips and tutorials. It’s also where — within the framework of our regular DataViz Weekly feature — we keep you posted on new interesting data visualizations from out there on the web. Today, we’ve chosen to highlight the following information graphic works:
- street orientation in cities around the world;
- occupations and earnings across the United States;
- birth control methods;
- car output of Tesla against North America’s most productive factories.
Data Visualization Weekly: July 13, 2018 — July 20, 2018
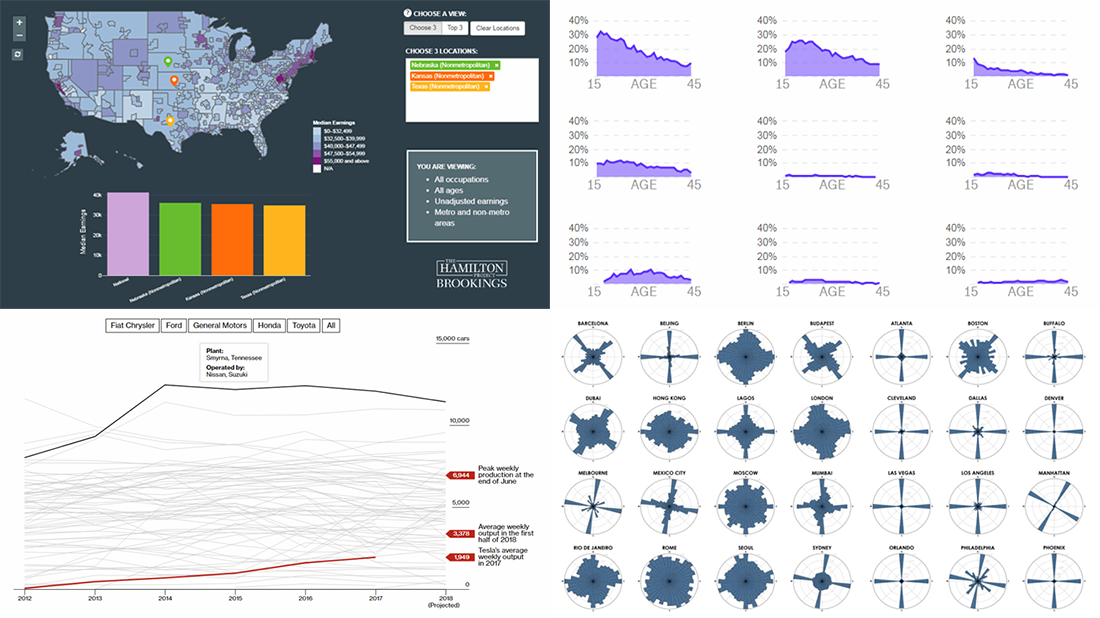
Street Orientation in World Cities
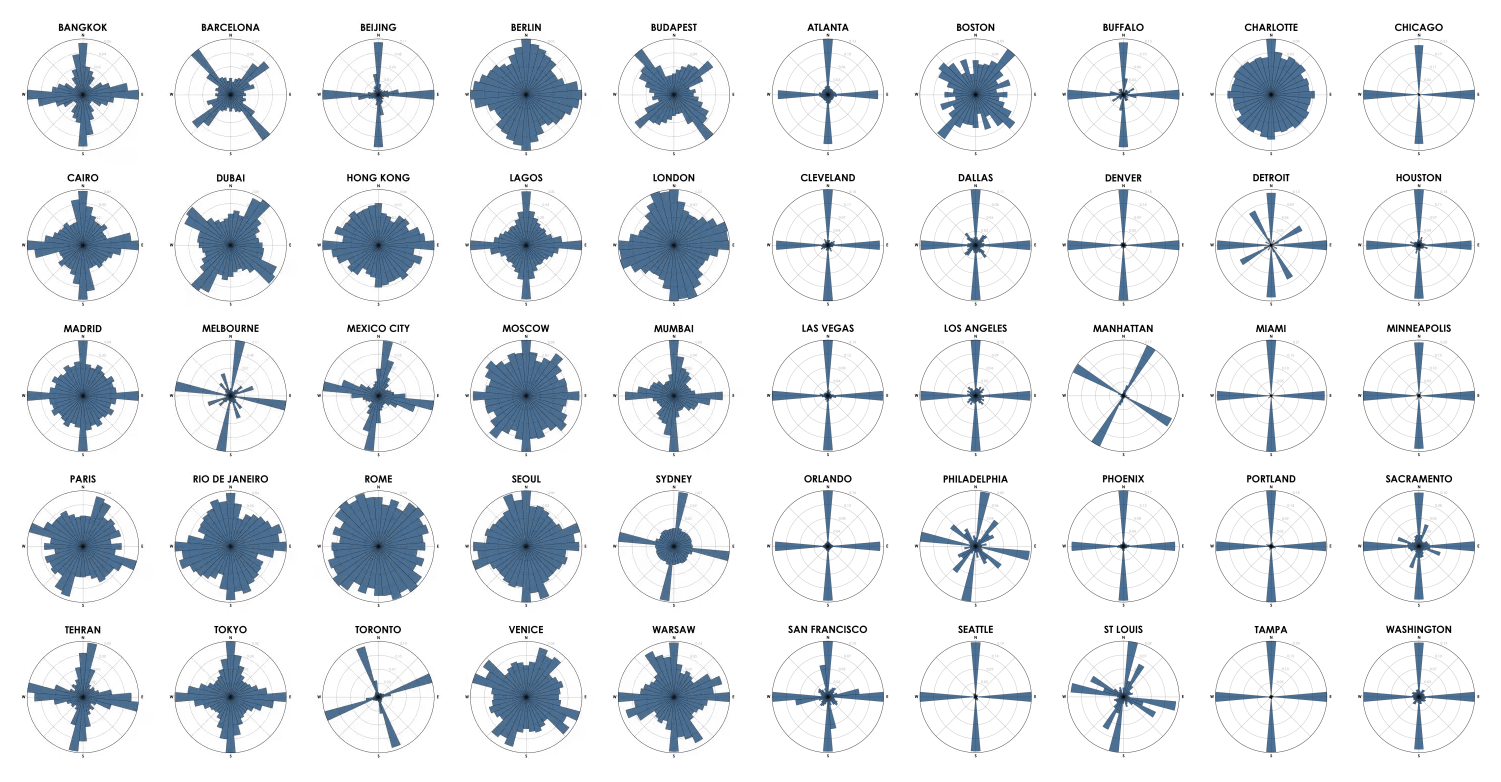
Jeff Boeing, a postdoctoral researcher in the Urban Analytics Lab at the University of California, Berkeley, visualized the orientation of the streets in 25 major cities of the United States with the help of polar charts. Shortly after that, he followed up with another cool dataviz work on the same subject and added diagrams of 25 world cities. Inspired by these data visualizations and earlier Seth Kadish’s charts, Mapbox engineer Vladimir Agafonkin went even further and created an interactive map that can display the road network orientation for absolutely any place in the world. Check out these interesting polar chart-based information graphic works.
Occupations and Earnings in U.S.
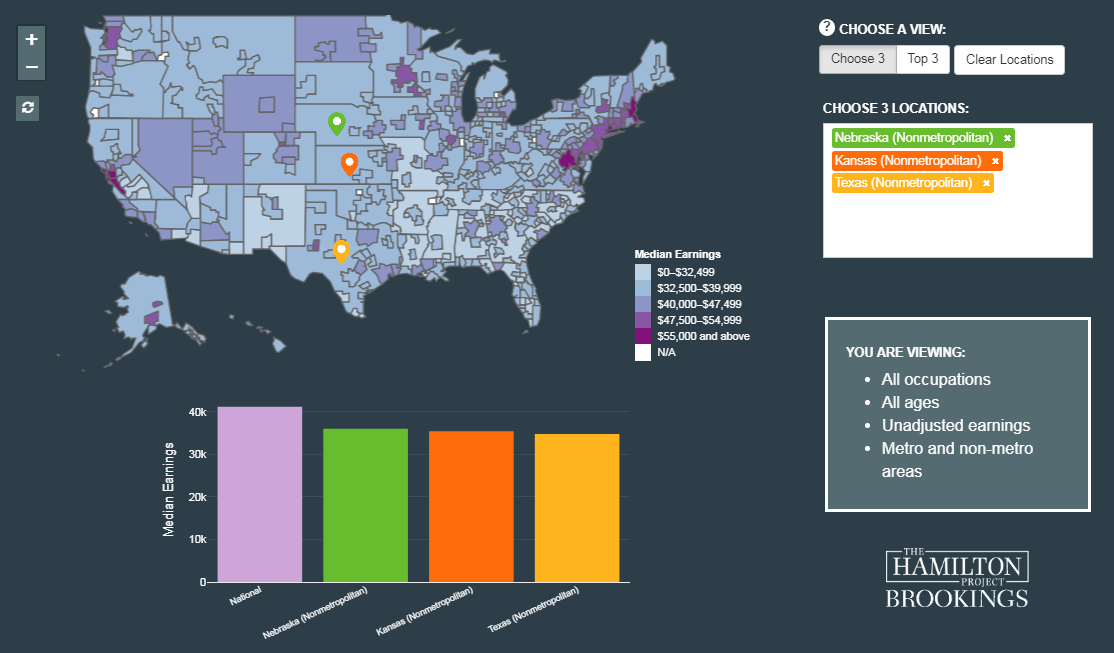
The Hamilton Project built an interactive tool that nicely shows how earnings for a given age and occupation vary across the U.S. It also allows us to view the data adjusted for cost of living and taxes, which makes this work especially interesting and useful. The interactive visualization accompanies an in-depth economic analysis of where work pays.
Birth Control Methods
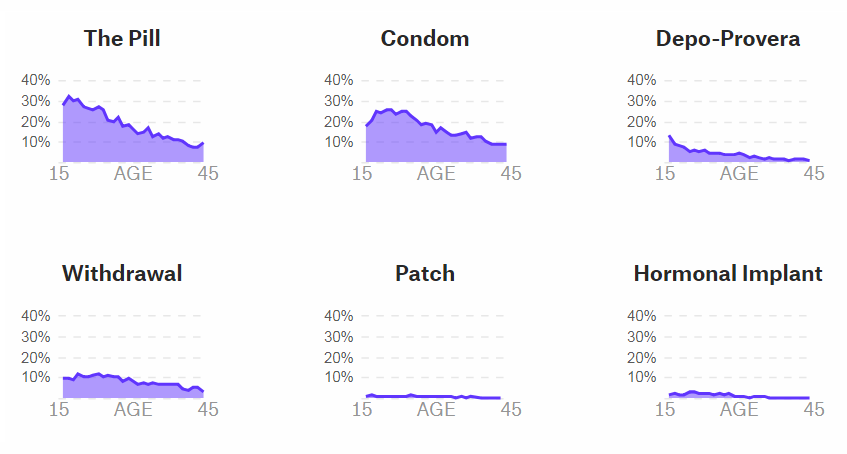
The Pudding’s Journalist Engineer Amber Thomas looked into the birth control methods, making use of data from the National Survey of Family Growth conducted by the Centers for Disease Control and Prevention (CDC). Look at the charts in the article and learn about contraceptives, their use by age, common combinations, side effects, and more.
Car Output in North America: Tesla Against Most Productive Factories
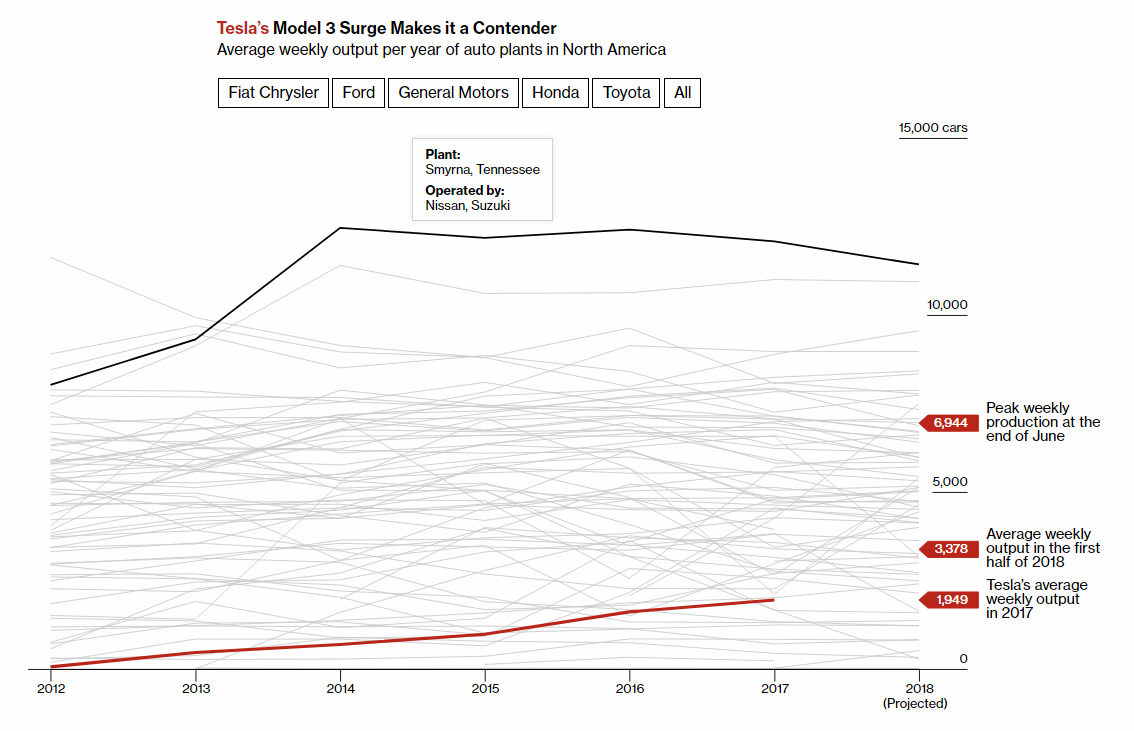
Bloomberg visualized data about the average weekly output of the most productive car factories in North America and compared Tesla’s production against them. Explore the chart to learn how Fiat Chrysler, Ford, General Motors, Honda, Toyota, and Tesla stack up in terms of their North American plants’ performance.
***
In the previous issues of Data Visualization Weekly on our blog, you’ll find more cool data graphics of the recent times. Thank you for your attention and interest in dataviz!
- Categories: Data Visualization Weekly
- 1 Comment »