 Hello Friday! DataViz Weekly is here to entertain you with several new interesting data graphics we’ve recently come across.
Here’s a quick list of what visualizations we are glad to draw your attention to this time, to start with:
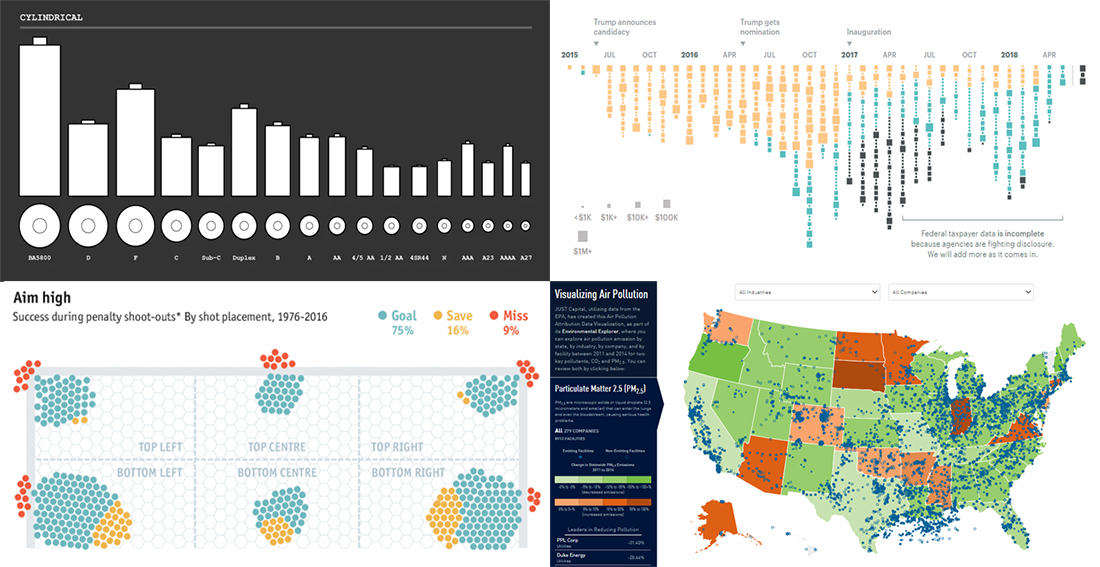
- all battery sizes;
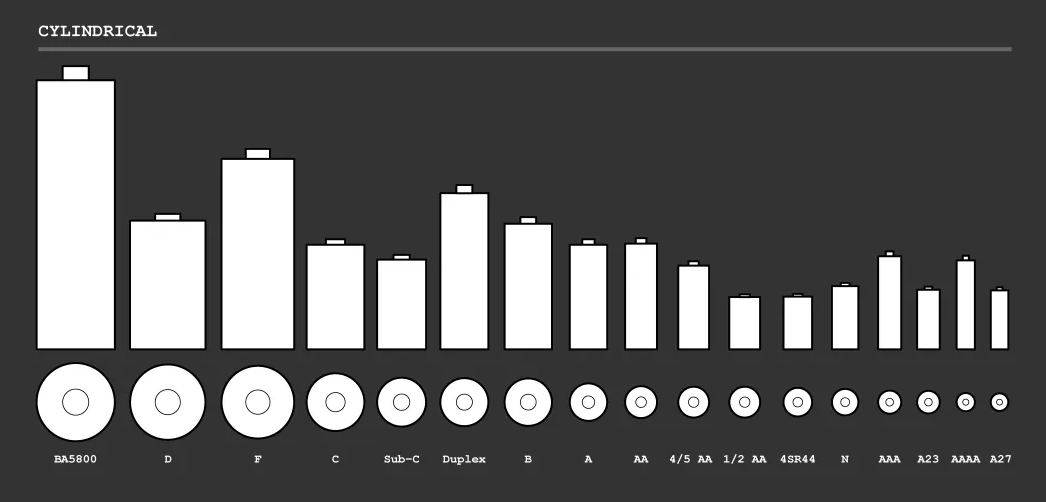
- political and government spendings at Donald Trump’s properties from 2015 to 2018;
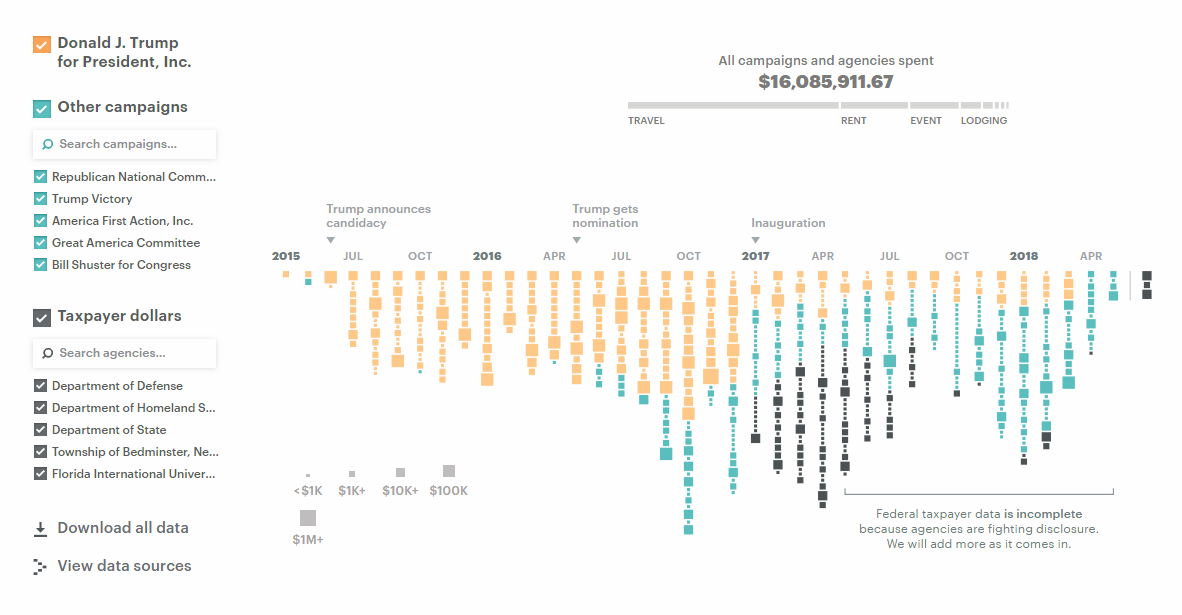
- Environmental Explorer;
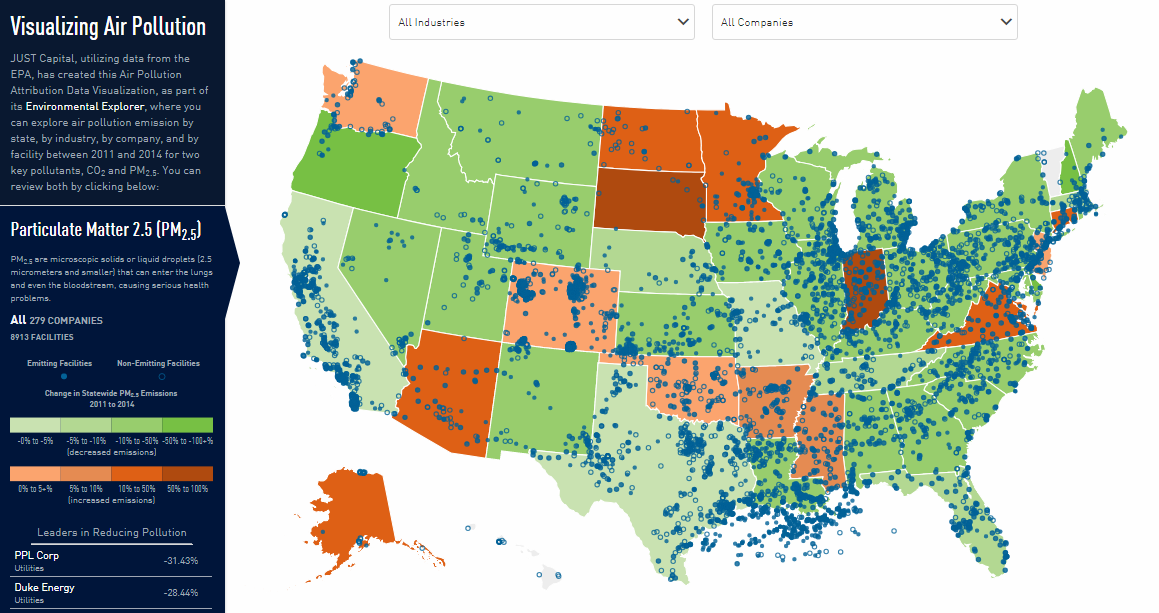
- FIFA World Cup and UEFA Euro penalty shoot-outs.
Data Visualization Weekly: June 29, 2018 — July 6, 2018
All Battery Sizes Visualized
Nathan Yau took all the battery sizes from the List of battery sizes on Wikipedia and visualized them all on one diagram. The picture above is just a small part of it. Check out the whole visualization on FlowingData to see the sizes of four rectangular, seventeen cylindrical, and over fifty button cell batteries.
Political and Government Spendings at Donald Trump’s Properties
ProPublica found more than 16 million US dollars received by Donald Trump’s business empire from his presidential election campaign fund, as well as Republican organizations, and even government agencies. Data about these spendings that are known now to have taken place between April 2015 and May 2018 is visualized on an interactive chart.
Environmental Explorer by JUST Capital
JUST Capital created a great interactive tool that allows us to see how various large companies in the United States stack up on a range of environmental issues. In addition to the rankings, it includes the Air Pollution Attribution Data Visualization which greatly shows air pollution emission by industry, company, facility, and state.
FIFA World Cup and UEFA Euro Penalty Shoot-Outs
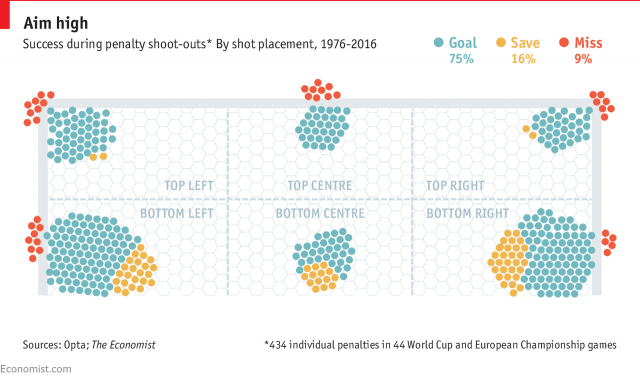
While the FIFA World Cup in the Russian Federation continues, we could not help featuring a visualization devoted to soccer. This chart from The Economist’s data team displays the shot placement for 434 individual penalties within the framework of 44 FIFA World Cup and UEFA Euro games’ penalty shoot-outs. According to what we see on the picture, here’s how to win a penalty shoot-out: Kick high (and don’t miss). But first, win the coin flip and select to kick first. Learn more on The Economist.
***
For now, that’s all we wanted to share with you this time. Many thanks for visiting our blog and checking out cool data graphics, and may all of you have an amazing weekend time!
- Categories: Data Visualization Weekly
- No Comments »