 Data visualization keeps gaining popularity as a great way to represent information in an insightful manner, and a lot of charts and infographics come out every day. We are glad to continue our DataViz Weekly series, helping you not miss out on some interesting visualizations.
Today, we are sharing visualizations of data about the following:
- Southern United States’ music in 1939;
- leading causes of death in the US in 1980–2014, by county;
- nuclear bomb effect on your neighborhood;
- opinions on Brexit in the UK.
Data Visualization Weekly: March 30, 2018 – April 6, 2018
Southern Music in 1939
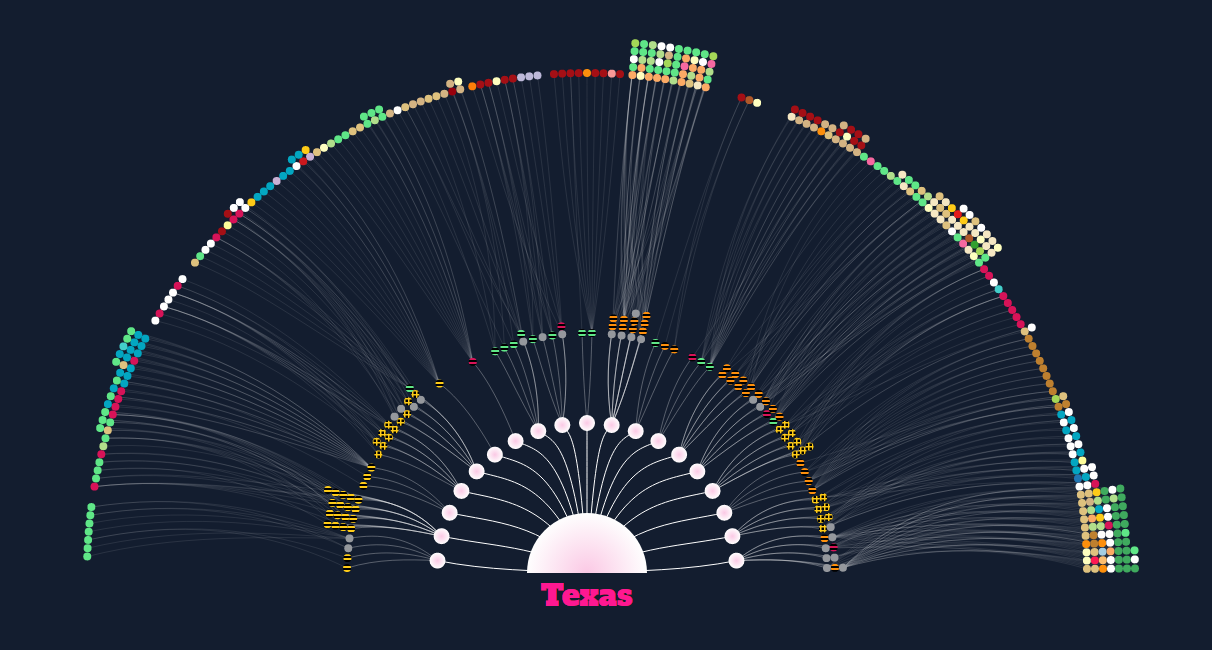
In 1939, two musicologists, Ruby and John Lomax, traveled the American South on a 3-month and 6,502-mile-long trip, aiming to document local musical traditions. Nowadays, Aditya Jain tells their story and shares the recordings they managed to collect, using some fascinating visualizations.
Mortality Rates for Leading Causes of Death in US Counties in 1980–2014
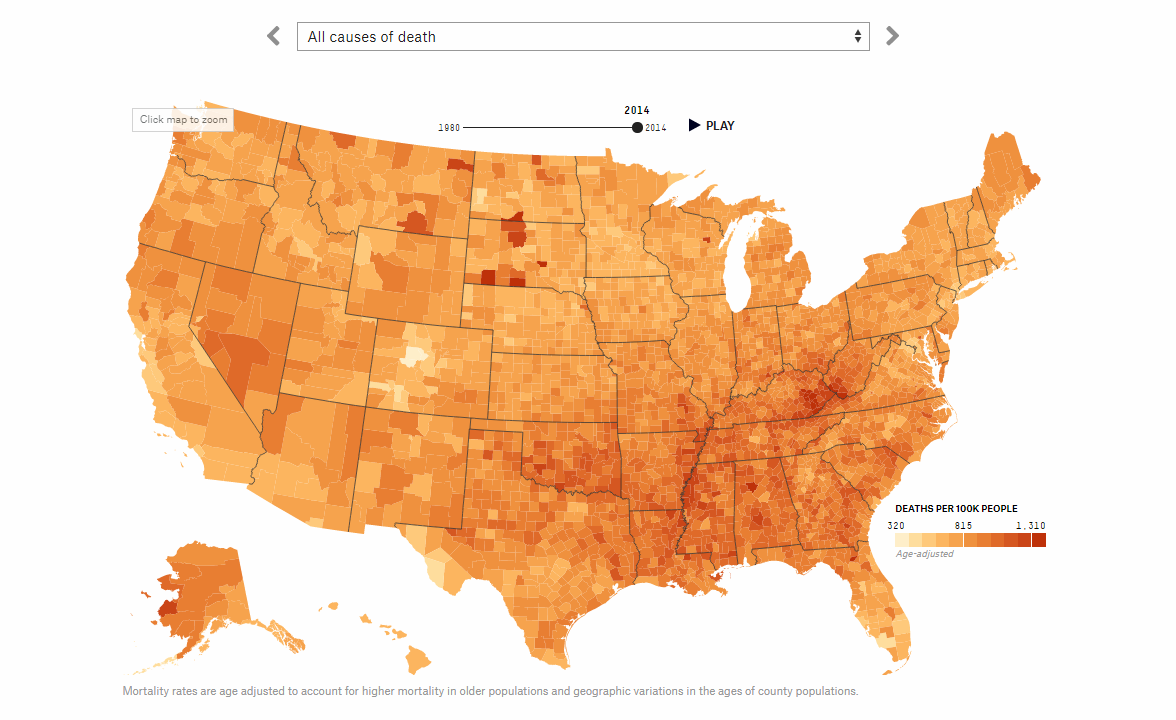
What do the Americans die from, and how mortality rates differ from county to county? FiveThirtyEight made an impressive data visualization work based on ф research of the Institute for Health Metrics and Evaluation to help you get answers to these questions.
Nuclear Bomb Effect on Your Neighborhood
![]()
If a nuclear bomb detonated in the city you live in, what exactly would happen? Outrider Foundation visualized possible effects for four bombs: Little Boy, Hwasong-14, W-87, and Tsar Bomba. Select one, choose a blast type (surface or air burst), specify a location, and explore what consequences such an explosion would have in terms of the number of fatalities and injuries, as well as the area of fireball, radiation, shock wave, and heat.
Opinions on Brexit in UK
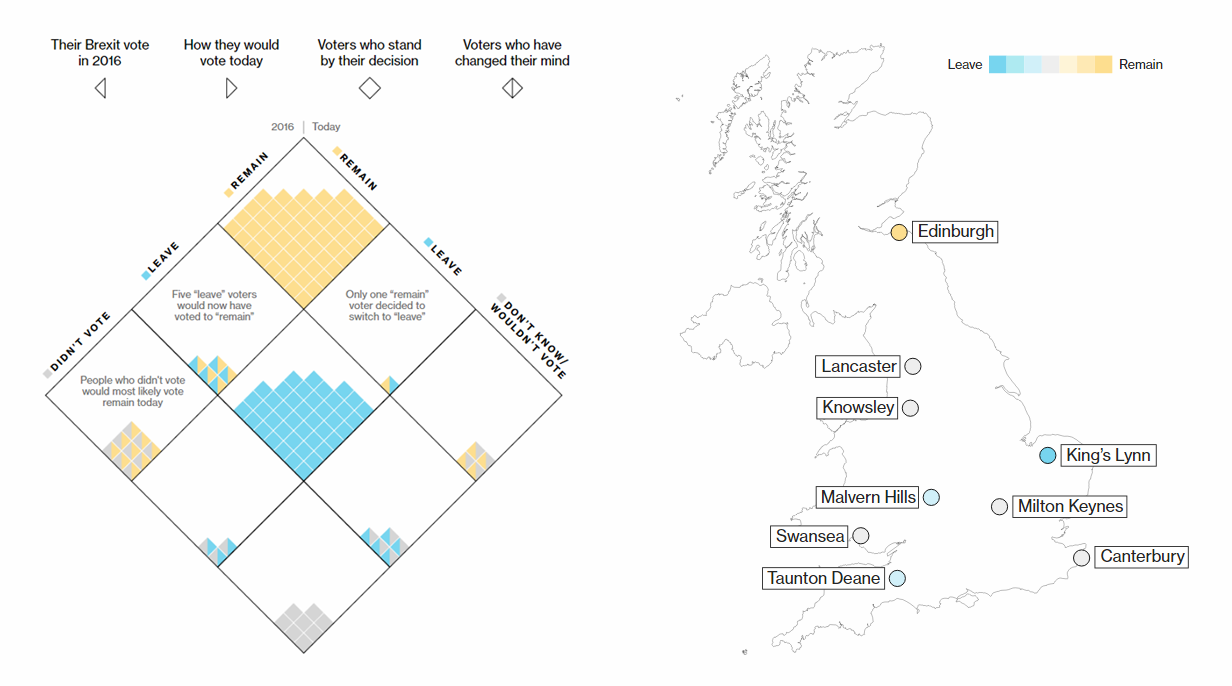
One year before the official Brexit time, what do the British think about leaving the European Union at the moment and how their opinions on that have changed? Bloomberg journalists interviewed 100+ people in different locations across the country to find out. Check out the results of their “Portrait of Brexit Britain” research with visualizations representing the data they’ve collected.
***
We also invite you to check out a visual essay on animated transitions in data visualization created by Alec Barrett and a useful reading on what to consider when building choropleth maps by Lisa Charlotte Rost.
Have a great weekend!
- Categories: Data Visualization Weekly
- No Comments »