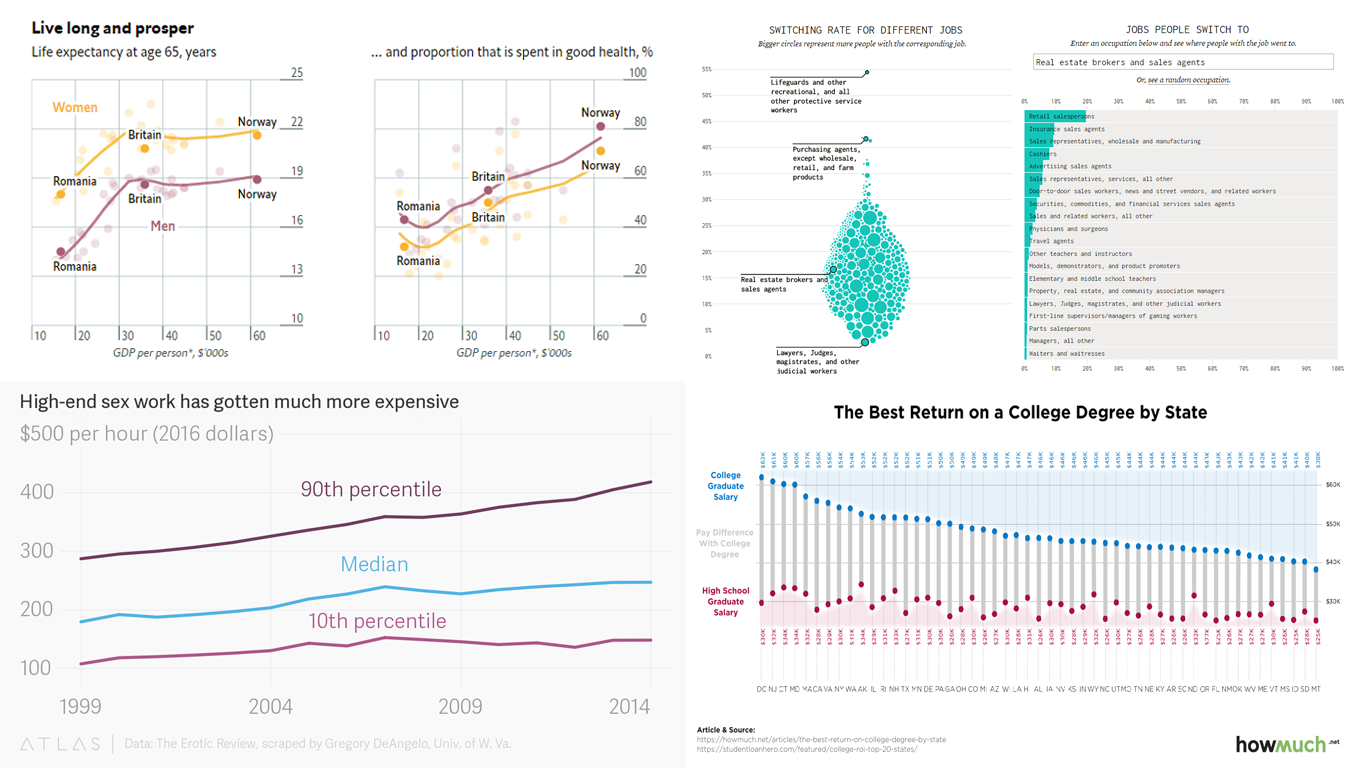
 Hello reader, it’s nice to have your attention once again. Today we present to you another DataViz Weekly post, comprising a range of brilliant data visuals, showing different data revolving around four different issues to tell stories about them. In this article, we take a closer look at:
- Some reasons why many people quit their job and where they go after resigning.
- The significance of investing in college education.
- How the internet has impacted the market for sex.
- The relationship between income, life expectancy and health, based on a recent survey carried out in Europe.
The simple charts below will help you understand the data, get new insights into these four areas and see some hidden patterns as well as trends in each one of them. So, let’s get started right away.
Data Visualization Weekly: November 24, 2017 – December 1, 2017
Where Do Many People Go After Quitting their Current Job?
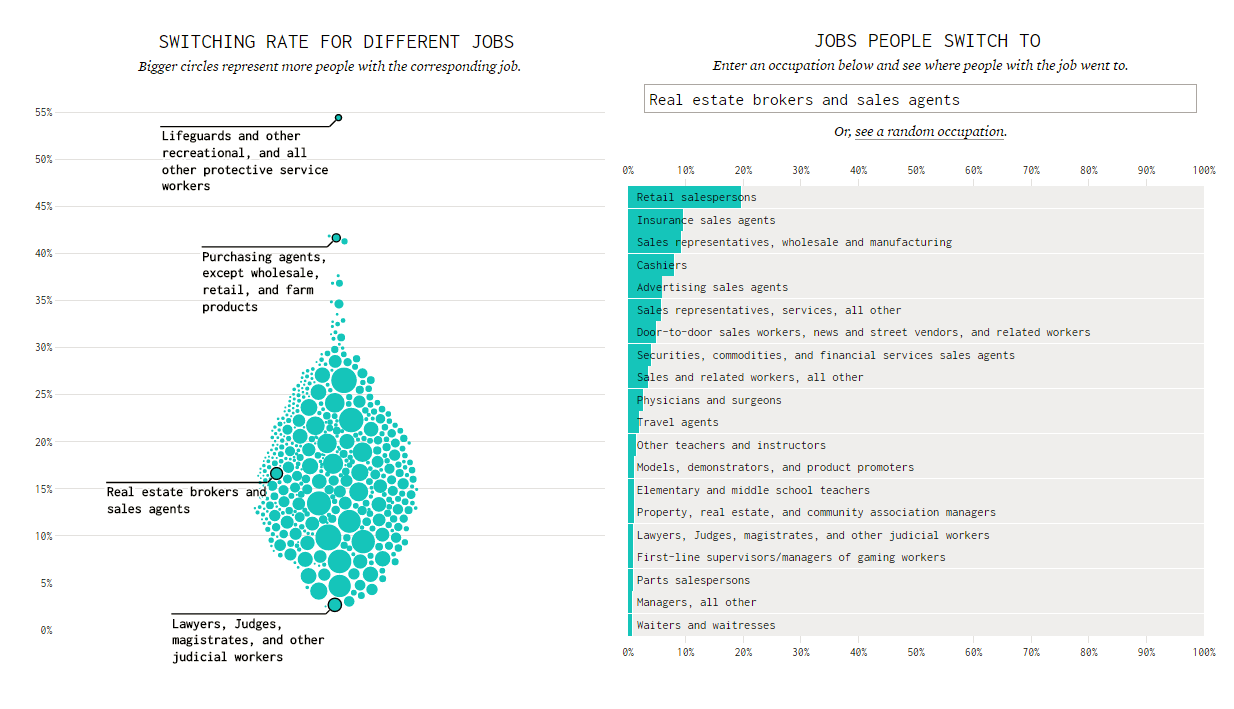
Employee resignation is a problem every business will have to deal with every once in a while. Every now and then, a boss in a company somewhere will regret seeing a great employee leave his/her organization for a number of reasons. It is something human resource personnel cannot control.
The majority of employees resign from their job due to a number of reasons, including frustration from bad bosses, lack of motivation as a result of working within a less challenging environment and low salary. According to a research involving more than 10,000 employees, career advancement is another major reason why people leave their job.
Question is where do many people go after they quit their current job? Do they look for another job similar to their previous one, or do they pursue something completely different?
Go through the exciting data complemented with an example of brilliant data visuals on FlowingData to find out. See what people did with their lives after quitting their job. The data comes from the Current Population Survey, between 2011 and 2016, which was carried out by The Census Bureau and Bureau of Labor Statistics.
Why Going to College Is the Best Investment Decision of Your Life
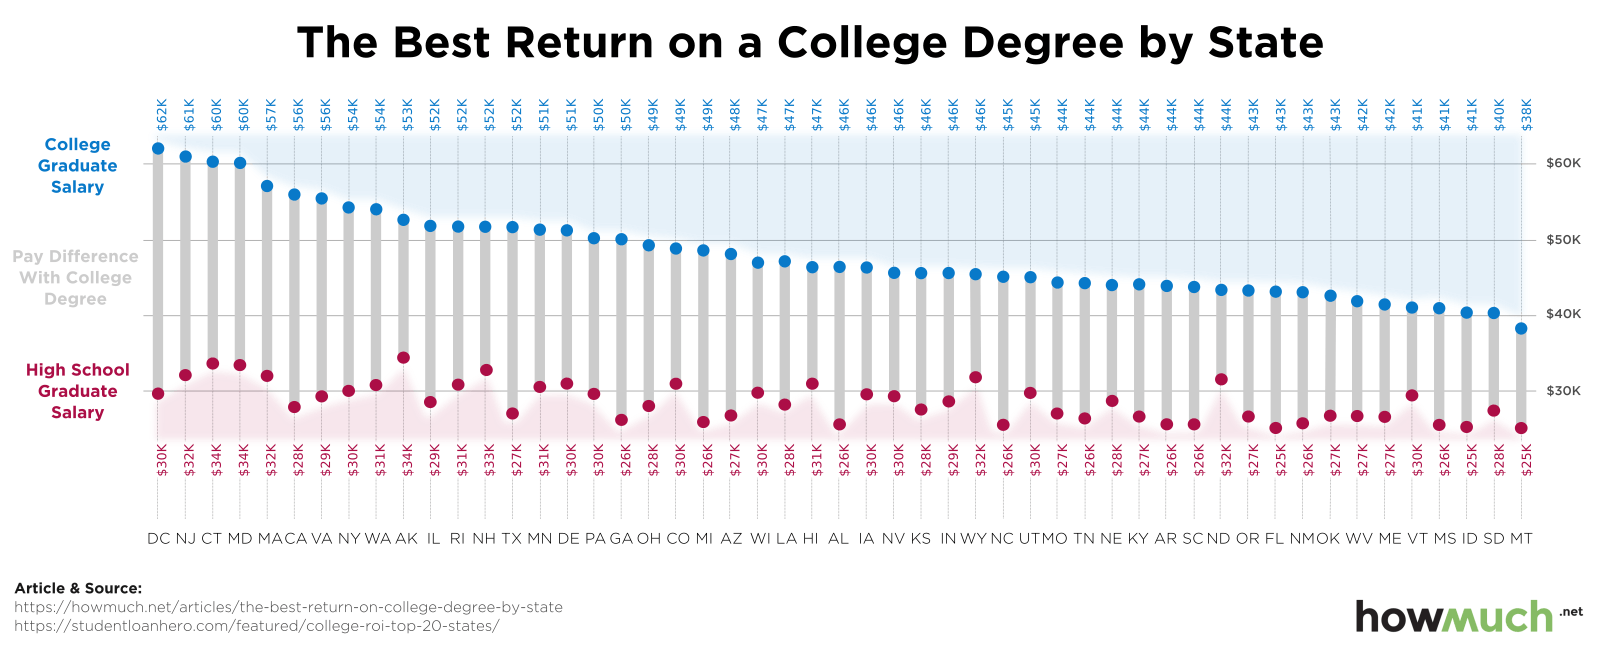
Education is the key to success and the efforts you make to earn your degree certificate will get rewarded anywhere you go. Research has shown that going to college is still the best way to get a good job.
Surprisingly, many individuals believe that college is not worth the cost, or that student loans are way too high to merit the investment. They are of the opinion that going to college only sucks your money even though there is no guarantee that you will get a good job and become successful once you graduate.
Even though that notion almost sounds true and one can easily believe in it, nothing could be further from the truth than this.
Check out the simple chart on Howmuch.net to see why going to college is the best investment decision you could ever make in your life. These figures come from Student Loan Hero, a website that helps students fund their higher education.
The visual element displays a salary bracket for each state in the US with higher numbers and lower numbers representing two different groups of salary earners. The higher numbers show salaries for employees with college degrees, whereas the lower numbers indicate the average salary for an average high school diploma holder. The difference between these two sets of numbers is actually the return on investment you would get as a result of earning a college degree. See the average returns on college investment per state.
How the Internet Has Changed the Market for Sex
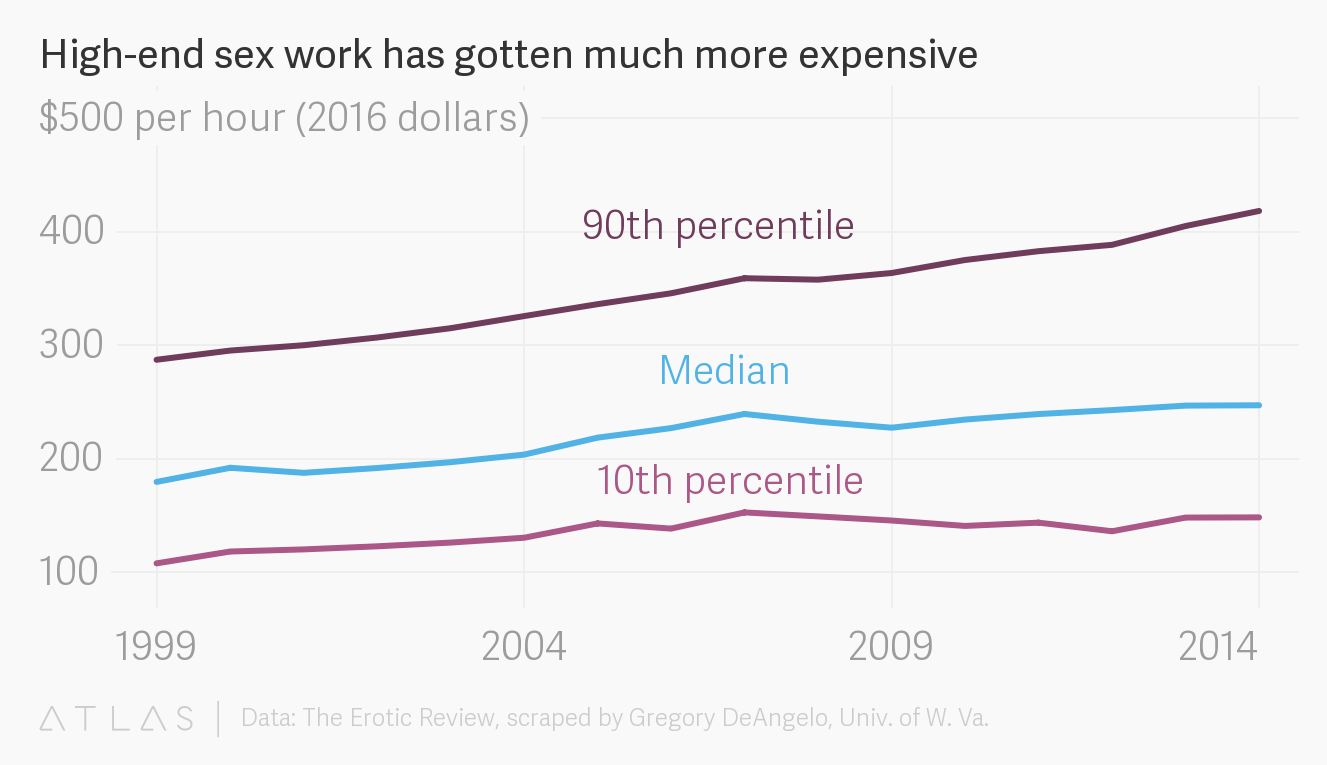
The internet has transformed the adult entertainment industry a hundredfold. It has brought positive impact on the business of sex workers, especially for those who offer illegal sex services.
It is because of the internet that there are now more ladies selling sex, more clients buying it, and higher incomes for sellers. It is not a surprise that sex workers now earn between $270 and $300 per hour on average.
Check out a set of charts illustrating this story on Quartz to see how the internet has enhanced sex trade. They are based on data from Gregory DeAngelo, a University of West Virginia economist who compiled many years’ worth of data from The Erotic Review website.
The data set was compiled from about 1.1 million reviews with in-depth descriptions of encounters, time spent, features of the sex worker, as well as price.
What Is the Relationship Between Income, Human Longevity and Health?
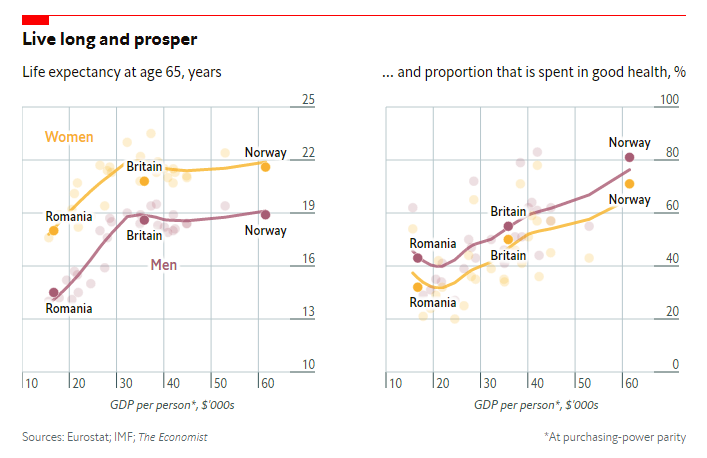
A study has found that in Europe, country GDP significantly affects the overall life expectancy, but it does not necessarily affect the health of citizens. However, there seems to be a strong correlation between life expectancy and health.
Looking at the data from 30 European countries on The Economist, one notes a powerful link between health and longevity. A trade-off between the two seems to be inevitable. As you can see, one may live to a very old age, but his/her final years may be characterized by poor health or vice versa.
The data suggest that longevity and health trade-off depends on gender and country. On average, the life expectancy of European women is between 76 and 85 years while that of men is between 66 and 81 years. However, women tend to spend much of that extra time in wretched health.
***
We hope you were able to get some new insights into these four particular areas with the help of the brilliant data visuals examples above. At least you now know where people go next after quitting their job. You also now understand the significance of investing in college education. You also saw how the internet has impacted the market for sex and how income, life expectancy as well as health correlate from country to country. And of course, you received a new portion of inspiration for data visualization.
Stay tuned and expect the next Data Visualization Weekly to be published next Friday.
- Categories: Data Visualization Weekly
- No Comments »