 Data is great. Visualized data is awesome! Charts, dashboards, infographics – all these are specifically designed to provide an advanced look into data, deliver a better insight, and finally, get a clearer understanding of what’s happening so we can make the right decisions.
We are keen on showing you some good data visualization examples each week to prove that. Here are the new ones we’ve decided to share this time:
- Trump’s approval ratings;
- cryptocurrency market;
- Las Vegas gunfire speed;
- map of all unicorn companies.
Data Visualization Weekly: September 29, 2017 – October 6, 2017
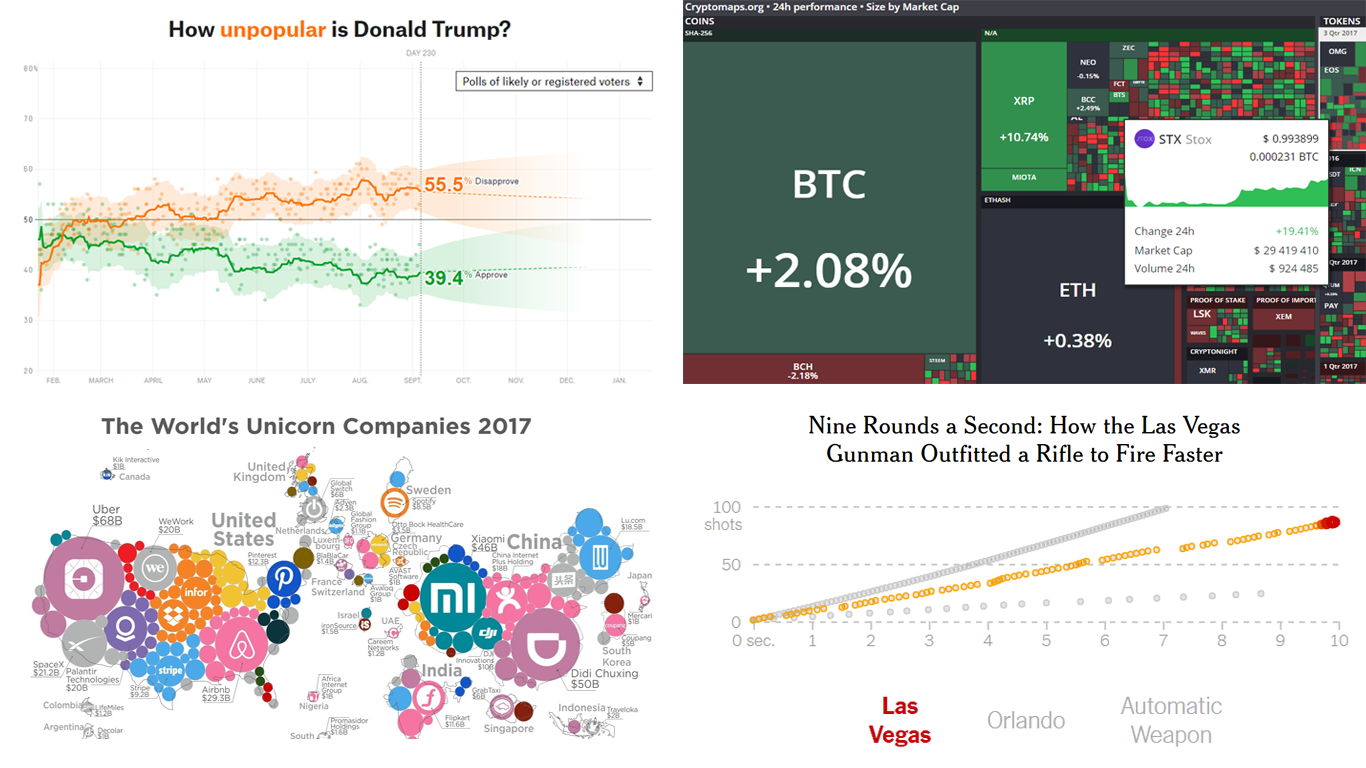
How (Un)Popular is President Trump?
FiveThirtyEight visualized data from a number of polls to display how US President Donald Trump’s approval and disapproval rating have been changing.
You can also get a better idea of what’s happening in this regard with the help of the 12 smaller charts. Each of them allows us to compare Trump’s ratings over time with those of the 12 past US presidents, from Harry S. Truman (1945-1953) to Barack Obama (2009-2017).
The methodology of how Donald Trump’s approval and disapproval data are processed and adjusted for the purpose of this cool interactive data visualization project can be found in the How We’re Tracking Donald Trump’s Approval Ratings article.
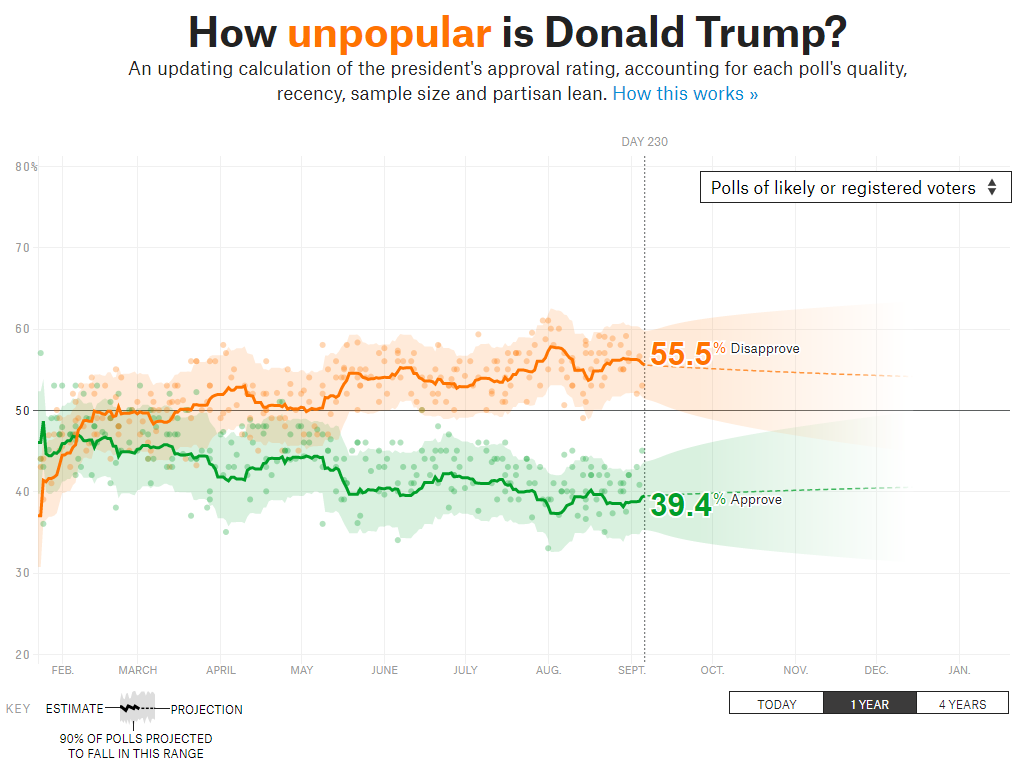
Cryptomaps: Cryptocurrency Market Heat Map
Cryptocurrency is likely to be the hottest trend nowadays. If you are already well into it, or even if not (yet?) – check out Cryptomaps, the cryptocurrency market heat map chart-based interactive data visualization.
Cryptomaps will tell you what this market looks like right now, including the current market volume, value, and recent price change for each of numerous cryptocurrencies: Bitcoin, Ethereum, Ripple, Litecoin, Dash, NEO, and so many others being traded out there.
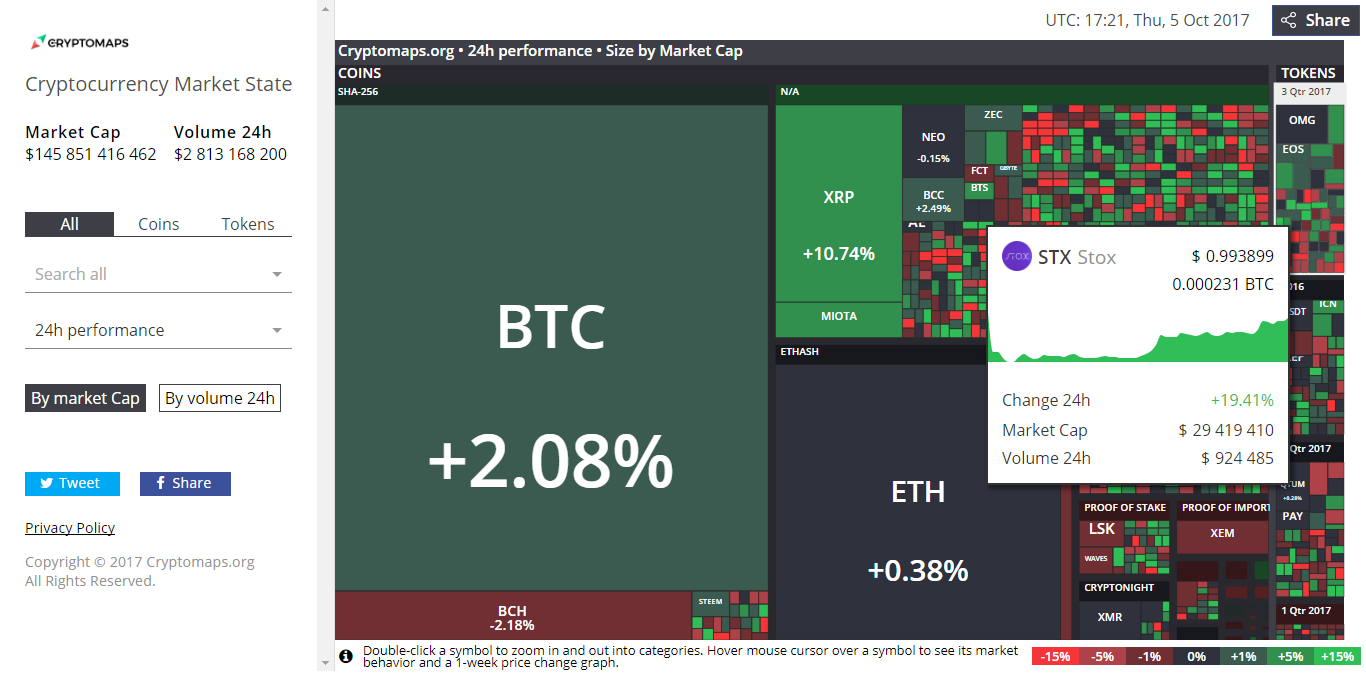
Visualized Data About Speed of Gunfire in Las Vegas
The recent tragedy in Las Vegas left a lot of people killed or wounded. Various media paid attention to different details of what, how, and why happened there.
For example, the New York Times elaborated on the firing speed. They visualized the corresponding data about the Las Vegas gunfire and the Orlando nightclub shooting in 2016 on a chart, along with the rate of a fully automatic weapon, for comparison. Check out the article to learn more and see why the gunman fired so fast.
World Map of Unicorns

Howmuch.net mapped the world’s unicorns based on their market value and HQ location. Check out the infographic.
As one would expect, the United States, China, and India are home to the biggest number of startups and companies with $1+ billion valuations.
***
In this Data Visualization Weekly issue, we certainly cannot help mentioning the release of AnyChart 8 that took place earlier this week. It is the new, module-based generation of our JavaScript (HTML5) charting libraries, and you definitely should take a look at what was added and improved to make AnyChart, AnyMap, AnyStock, and AnyGantt stand out all the more.
Stay tuned as next week we will share more examples of interesting data visualization. They will be cool, inspirational, and new, as always in Data Visualization Weekly.
- Categories: Data Visualization Weekly
- No Comments »