 Hello everyone! We continue our effort to find and publish the best data visualization examples on a regular basis. The current issue of Data Visualization Weekly lists and narrates about another four cool charts and maps of those that were shared on our Twitter and Facebook accounts just recently. They are:
- American Workday;
- US Jobs by Industry;
- The World’s Conflicts;
- Climate Explorer.
Without more ado, let’s get down to seeing them now!
Data Visualization Weekly: May 12, 2017 – May 19, 2017
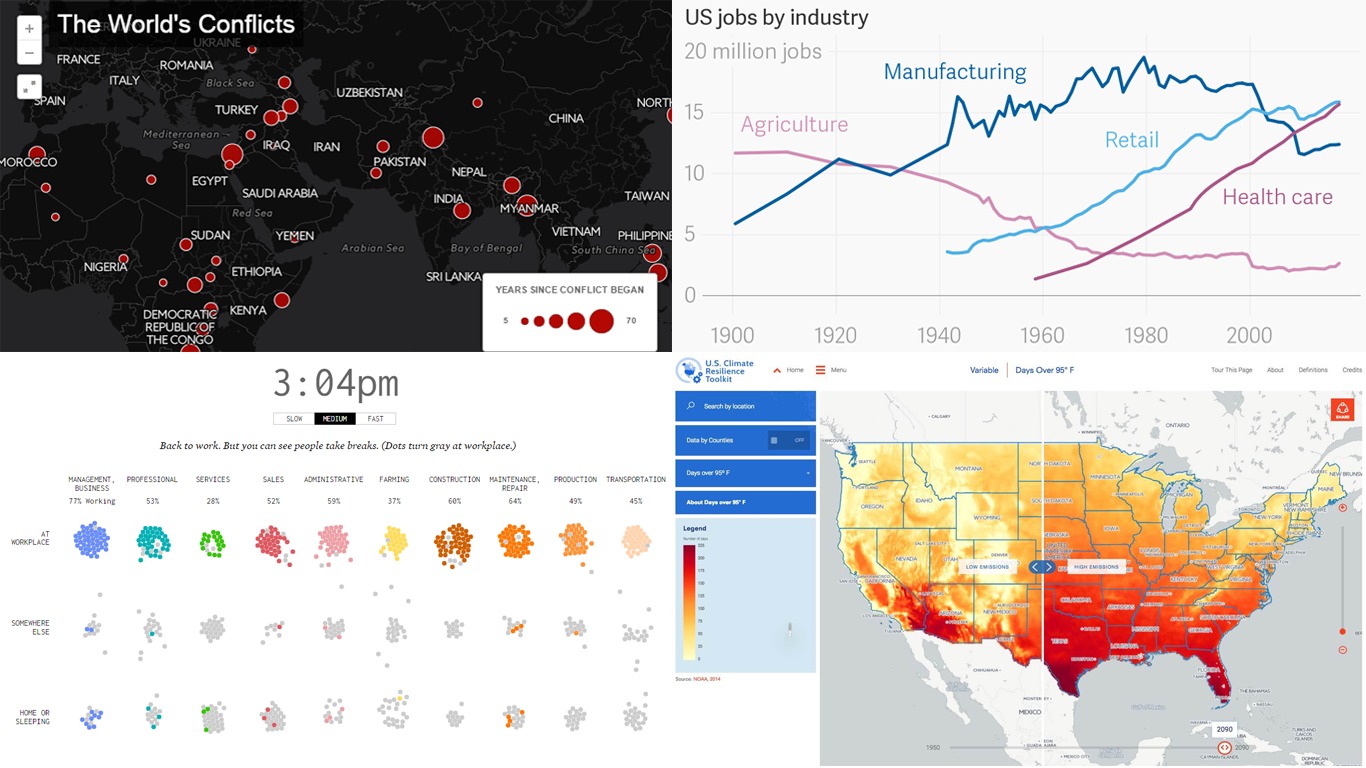
Visualization of American Workday: When and Where People Work
Simulating when and where people work https://t.co/nGQDQTxy2x pic.twitter.com/U3NDFf4GJ6
— Nathan Yau (@flowingdata) May 17, 2017
Nathan Yau made this great animation to visualize a typical day of an American. Using data from the American Time Use Survey, he shows how the average person spends the average day, moving between home, work, and somewhere else. No more words, just check out the original visualization with all things explained.
US Jobs by Industry, 1900-present
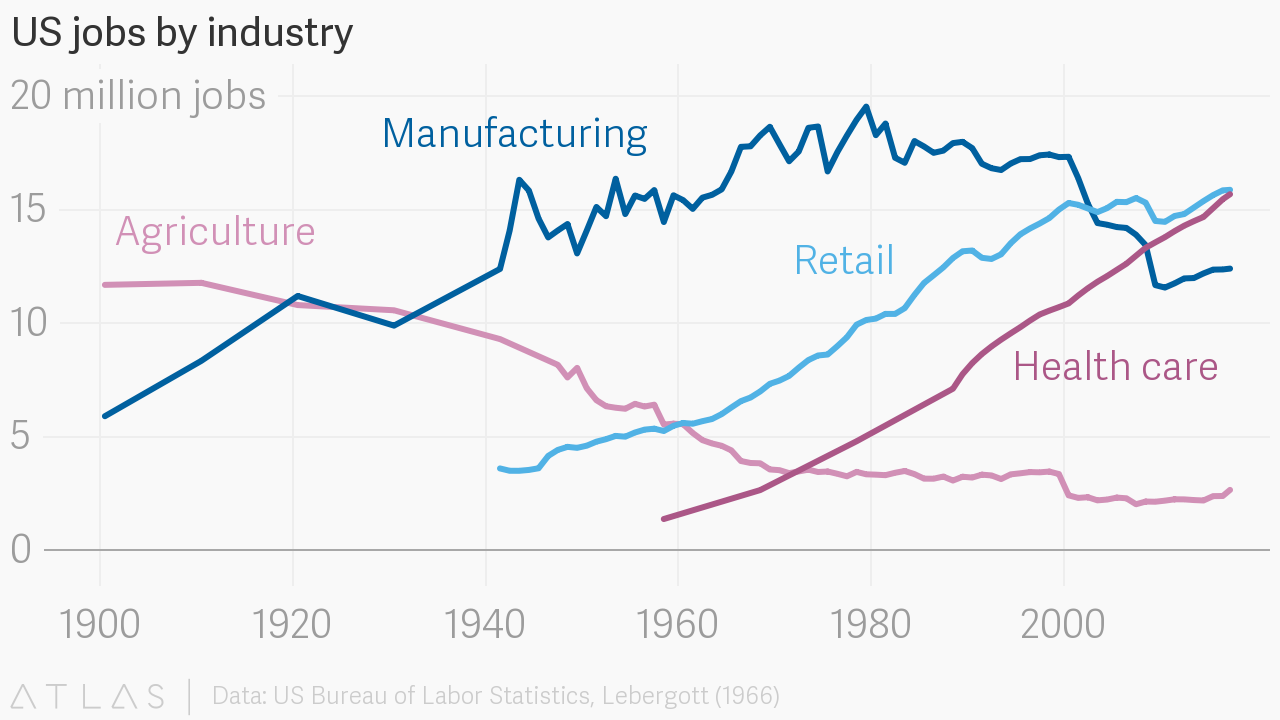
Healthcare is likely to surpass the retail business in terms of the number of jobs provided. And that has never happened in the American history yet. The chart shared by Quartz makes the trend clearly seen and, generally, brings great insights into the jobs in the US since 1900 till present days.
Interactive Map of All Ongoing War Conflicts
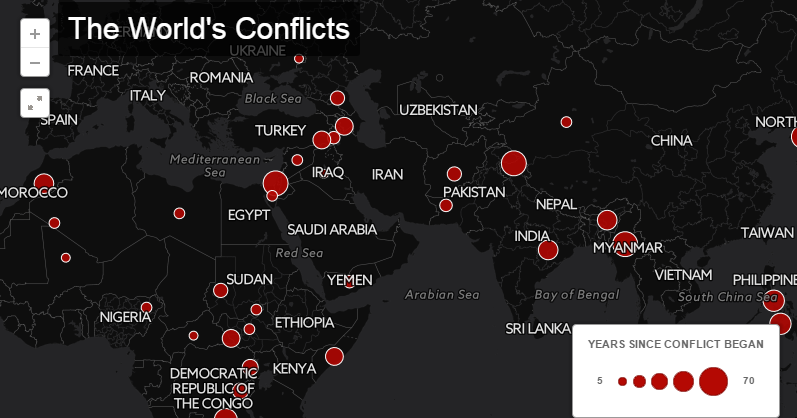
There are a lot of wars in the world that are happening right now. IRIN created this interactive map to tell us more about every active conflict and to remind: The world is not 100% peaceful.
Climate Explorer: Best Data Visualization Examples for Local Climate Trends
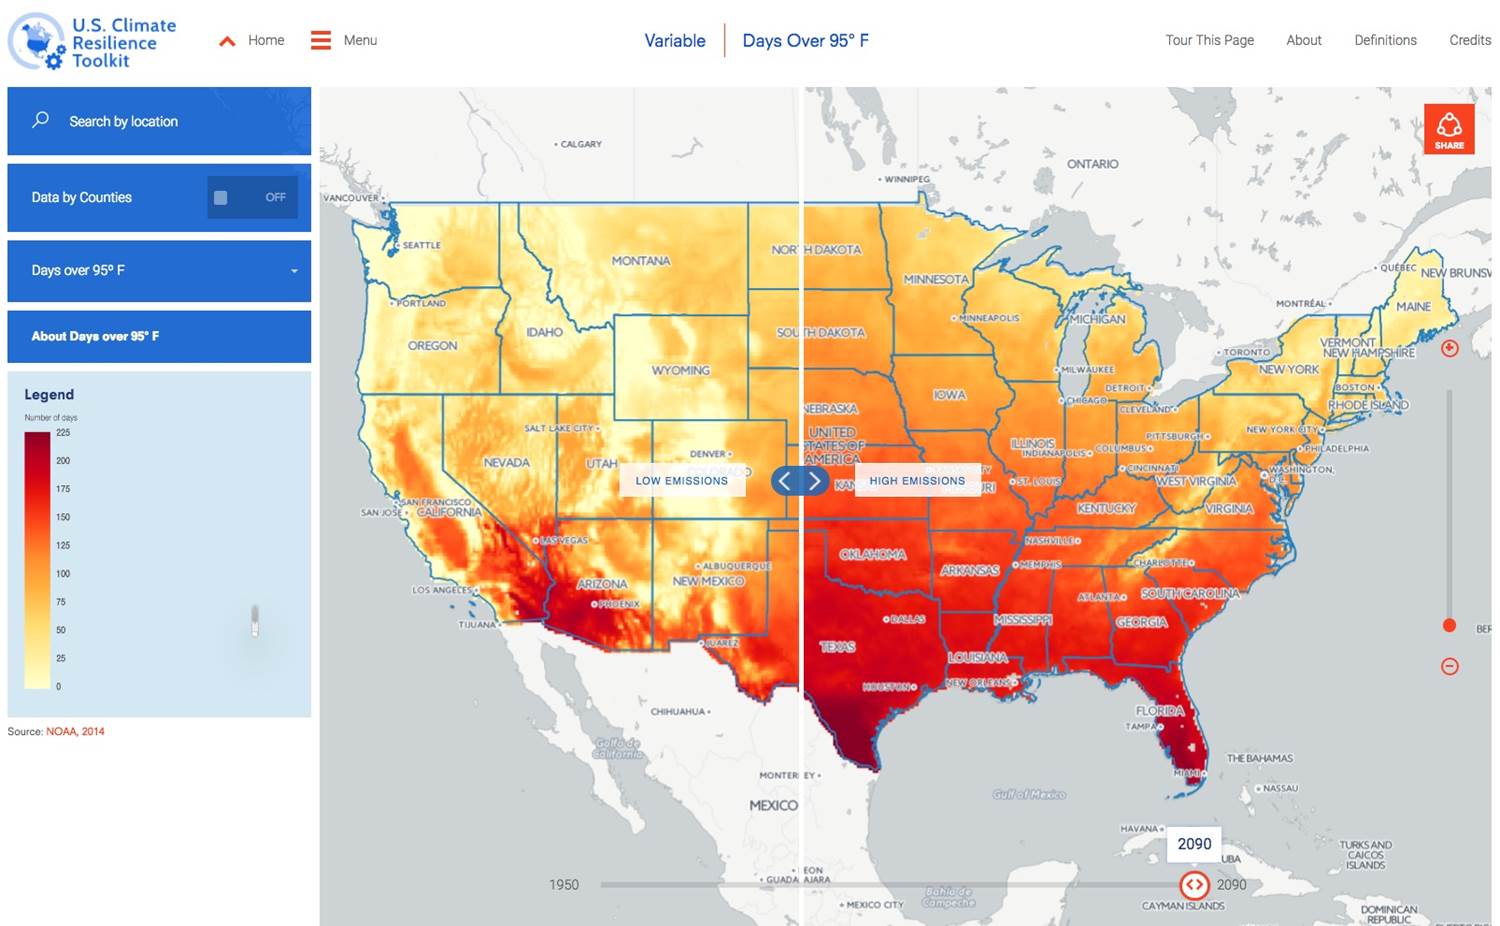
The final one of the best data visualization examples of the week we’ve included in the current DataViz Weekly is the Climate Explorer. It helps in understanding the climate change in every local area in the US. That said, you can easily check what’s expected in your home or business location.
These are all data visualizations that we wanted to share with you in this Data Visualization Weekly. Stay tuned to the series!
- Categories: Data Visualization Weekly
- No Comments »