This week we have shared with you on AnyChart Facebook Page and in Twitter some really neat data visualizations – including an HTML5 Gantt chart by AnyGantt. Here is a quick recap of our posts:
- How Do People Play The Trading Game? (Or: How 13,000 People Turned 108 Real Hours of Their Lives Into 6.7 Trillion Imaginary Dollars) – a nice trading game and an article about it on Bloomberg Business.
- How You Will Die – this colorful simulation by FlowingData tells you how and when you will die, given your sex, race, and age. Good news: mortality rate is much lower in the earlier years of life than in the older years. Another interesting fact is that if you get past a certain age, the probability to die of cancer decreases. Earlier we posted a simulation by the same author, predicting how long you will leave. Here it is (in case you did not see it): Years You Have Left to Live, Probably
- Is there a connection between performance and popularity in tennis? Untangling Tennis is visual and data analytic exploration of success in tennis, uncovering the relationship between the two things. In this article you can see a few of the many phenomena that can be discovered about the life and career of a professional tennis player using this data visualization project. You can play with it and discover your own findings here: Untangling Tennis: Tool.
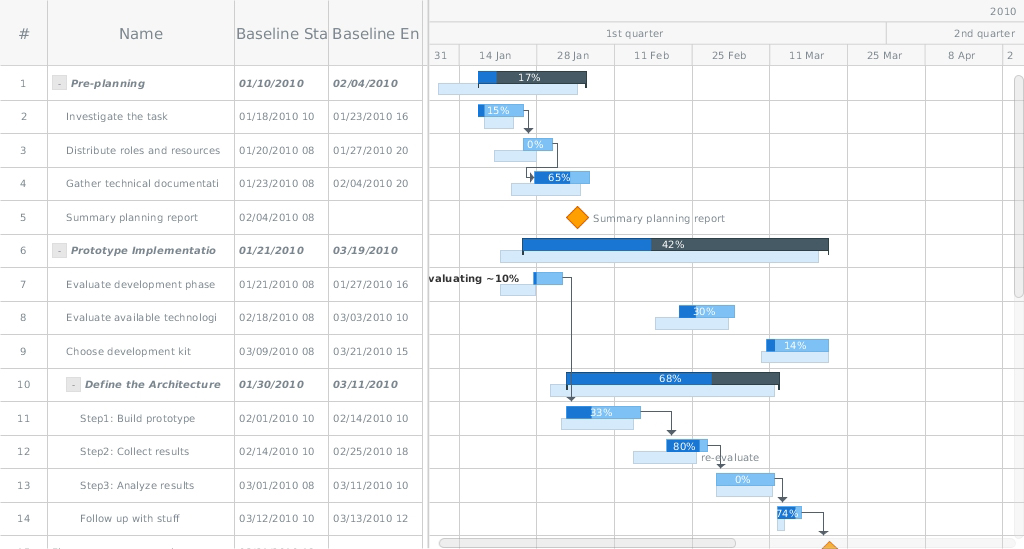
- Planned-vs-Actual: HTML5 Gantt Chart by AnyGantt – This HTML5 Gantt chart created with AnyGantt demonstrates how Gantts can be used for comparing plans and reality. A Gantt chart is actually a type of bar chart representing a project schedule (and, sometimes, other things), invented independently in 1896 and in the the 1910s by two different people. It was the second one, Henry Gantt, after whom Gantts were named. As you see, it is a complex data visualization containing a lot of information, and yet it is quite readable and visually appealing. AnyGantt, due to its’ flexibility and rich interactivity it offers, is a perfect tool for creating such a visualization.
- Categories: AnyChart Charting Component, AnyGantt, HTML5, JavaScript, News
- No Comments »
