One would think that the only mission of charts is presenting boring information in scientific works and at report-back meetings. However, charts, along with some other data visualization methods, are a very refined and expressive tool, so they are able to reproduce more elevated meanings as well and even can become a kind of art. These splendid prospects inspire us so much that we have introduced a new tag – Charts and Art.
Let’s begin with charts in fiction. There are only two examples we’ve found for the moment (fiction being a text first of all), but they clearly demonstrate the powerful tragicomic potential of line charts!
The first example is from The Life and Opinions of Tristram Shandy, Gentleman – a novel written by Laurence Sterne in 1769:
I am now beginning to get fairly into my work; and by the help of a vegetable diet, with a few of the cold seeds, I make no doubt but I shall be able to go on with my uncle Toby’s story, and my own, in a tolerable straight line. Now,
These were the four lines I moved in through my first, second, third, and fourth volumes.—In the fifth volume I have been very good,—the precise line I have described in it being this :—
By which it appears, that except at the curve, marked A. where I took a trip to Navarre ;—and the indented curve B. which is the short airing when I was there with the Lady Baussiere and her page,—I have not taken the least frisk of a digression, till John de la Casse’s devils led me the round you see marked D.—for as for ? ? ? ? ? they are nothing but parentheses, and the common ins and outs incident to the lives of the greatest ministers of state; and when compared with what men have done,—or with my own transgressions at the letters ABD—they vanish into nothing. In this last volume I have done better still—for from the end of Le Fever’s episode, to the beginning of my uncle Toby’s campaigns,—I have scarce stepped a yard out of my way.
If I mend at this rate, it is not impossible—by the good leave of his grace of Benevento’s devils—but I may arrive hereafter at the excellency of going on even
thus :—
which is a line drawn as straight as I could draw it, by a writing-master’s ruler (borrowed for that purpose), turning neither to the right hand or to the left.This right line,—the path-way for Christians to walk in! say divines——
——The emblem of moral rectitude! says Cicero——
——The best line! say cabbage planters——is the shortest line, says Archimedes, which can be drawn from one given point to another.—
I wish your ladyships would lay this matter to heart, in your next birth-day suits!

The second example is from Moscow to the end of the line – a prose poem that was written in 1970 by Venedict Erofeev (partly inspired by Sterne) and tells the story of a Russian alcoholic intellectual:
Shall I tell you what kind of individualized charts they were? Now, that’s simple: on elite vellum in black India ink I drew two axes, one horizontal, the other vertical. All the workdays of the previous month were indicated sequentially on the horizontal axis, the amount of alcohol consumed—calculated on the basis of degree of proof—on the vertical axis. Of course, only whatever was consumed on the job or before was tabulated, since the amount consumed in the evening remained relatively constant and was, therefore, of little interest to a serious researcher.
Thus at the end of the month the worker came to me with his report: on such and such a day, such and such an amount of such and such consumed, on another day so much of whatever. While I would illustrate all of that with a beautiful graph in black India ink on white vellum. Here, for you to admire, for instance, is the chart for Viktor Totoshkin, member of the Komsomol:
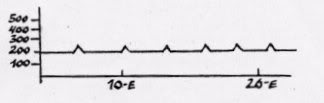
And this is Aleksei Blindiaev, member of the Communist Party of The Soviet Union since 1936, a seedy old dork:
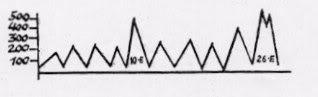
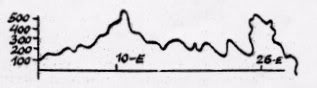
And here we have your faithful servant, ex-head cable-fitter and author of the poem Moscow to the End of the Line:
Aren’t these truly interesting graphs? Interesting even to the most superficial eye? They looked variously like the Himalayas, the Tyrol, oil derricks, or even the Kremlin wall, which, admittedly, I have never seen.
Another one liked like a morning breeze on the Kama River, a gentle splash with rippling beads of lantern light. Still someone else’s was like the beating of a proud heart, the song of the stormy petrel—in other words, pure Gorky—or like Aivazovsky’s trashy painting of the ninth wave. And all this, only looking at the external form of the line.
But, for anyone inquisitive (me, for instance), the lines blurted out everything that was possible to blurt out about the man and the heart of the man—all his qualities, from sexuality to practical matters as well as all his faults, both sexual and practical. Also, the degree of steadiness of temperament and of the tendency to treachery plus all his unconscious secrets, if he had any unconscious secrets.
You may have noticed that some charts disrespectfully violate the rules of mathematics and create paradoxes, which is the only way to do what art always does – to adapt a limited form to an endless content. That truly works!
- Categories: Charts and Art
- No Comments »