 Good visual data storytelling is when charts and maps do more than support the text. They do the explaining by making patterns easier to see, putting numbers in context, and helping readers follow the key points. In this edition of DataViz Weekly, we share four new pieces that do exactly that:
- Neglected tropical diseases progress — The END Fund
- Health insurance subsidy cliff — The Upshot
- ICE detainee transfers across the United States — The Minnesota Star Tribune
- Tariff promises versus math — The Washington Post
Data Visualization Weekly: January 30 – February 6, 2026
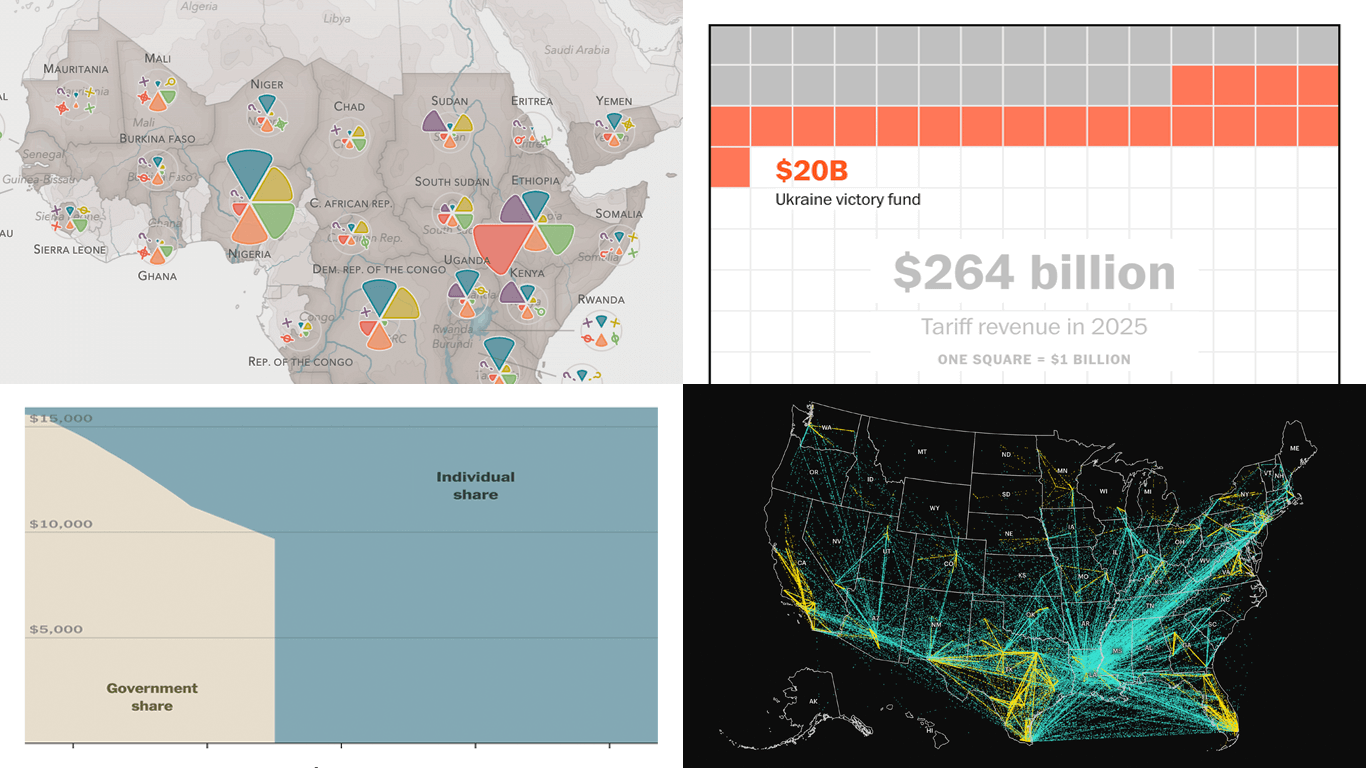
Neglected Tropical Diseases Progress
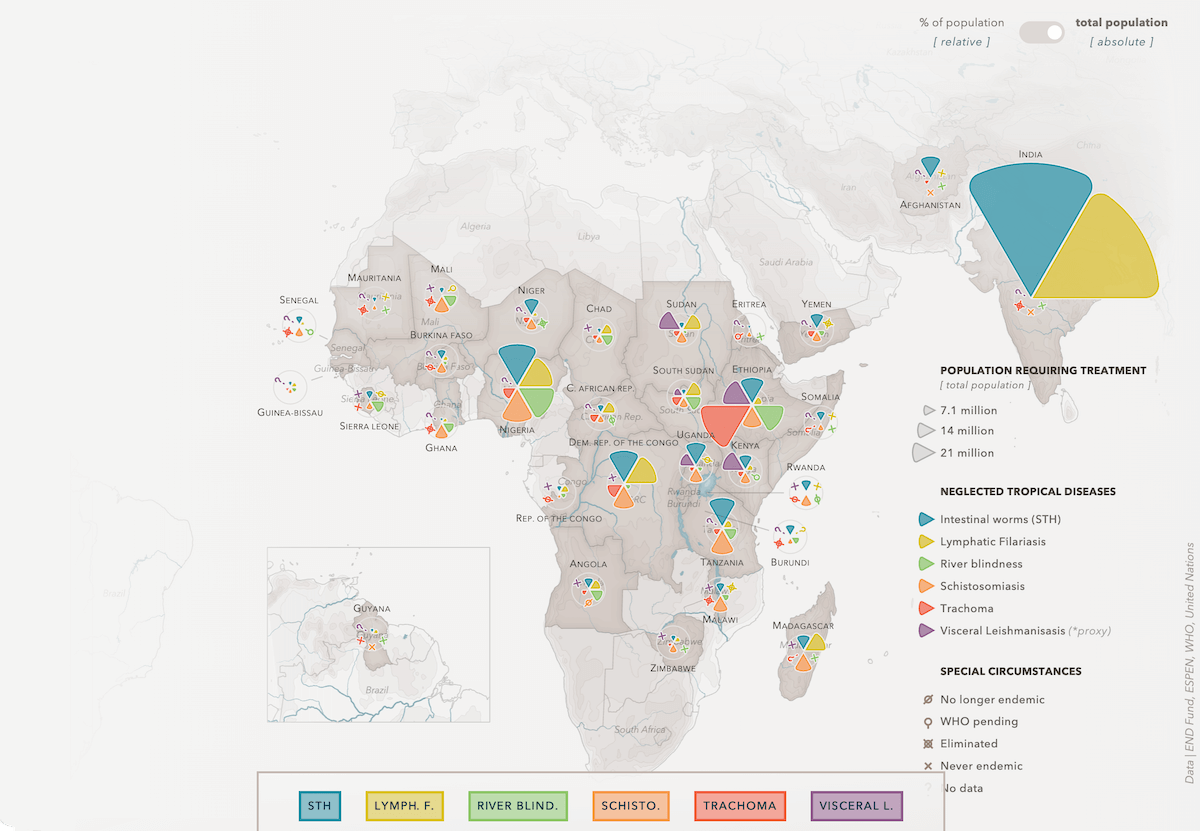
Neglected tropical diseases (NTDs) affect about 1.5 billion people worldwide, including roughly 1 billion children. The global target is to eliminate NTDs by 2030, and the world has made progress, even as funding and attention still lag behind need.
The END Fund created visualizations that show the burden of six common NTDs and how treatment needs and outcomes have shifted over time. The story opens with an interactive map that marks the 31 countries where the END Fund is active. Each is paired with a polar column chart that breaks down the share of the population requiring treatment by disease. A toggle switches the view from percentages to totals, changing the relative chart sizes. Hover tooltips add bullet-bar summaries for quick comparison. After the geographic view, the piece moves into more detail with additional charts, including line and area charts.
See the project on the website of the END Fund, with data visualization by Nadieh Bremer.
Health Insurance Subsidy Cliff
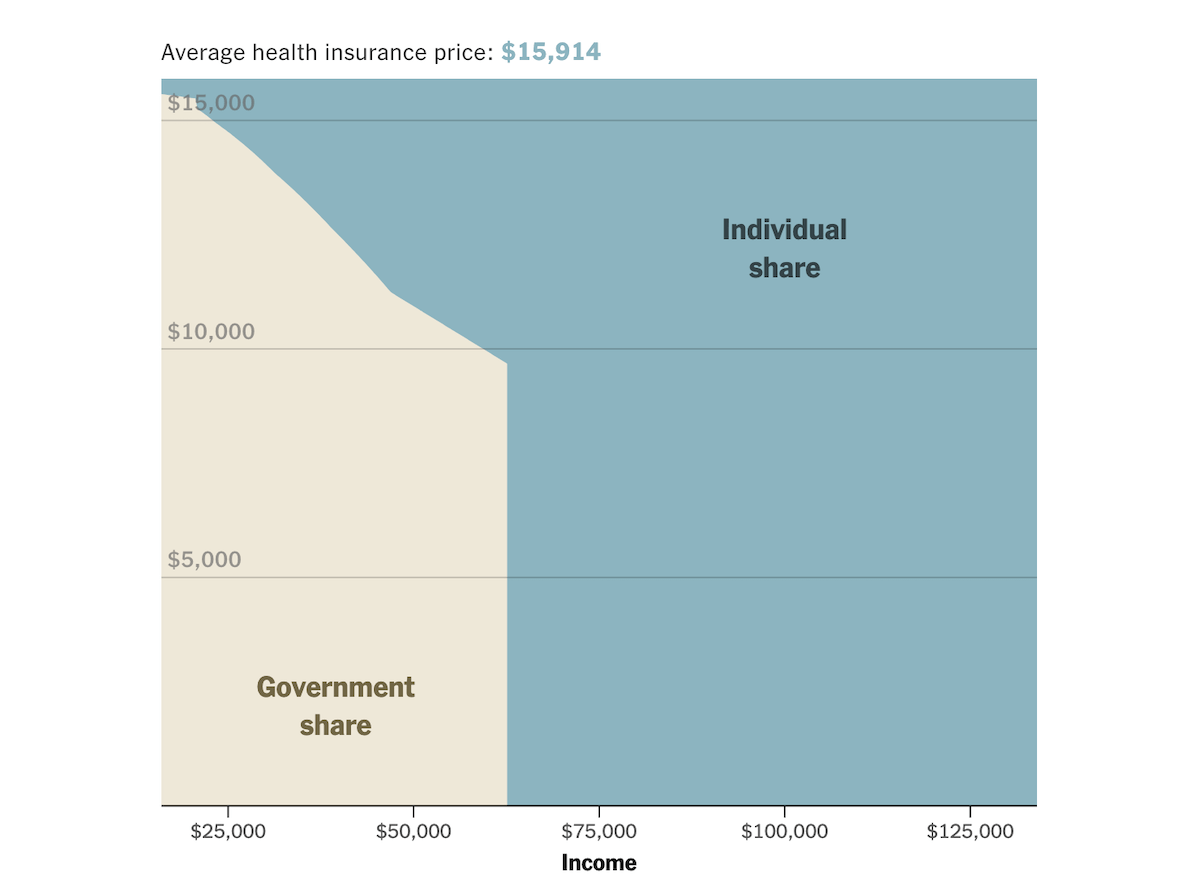
Open enrollment under Obamacare (the Affordable Care Act, ACA) has ended, and many Americans are facing higher health insurance costs. The biggest jumps are hitting people who now fall just above the income level where subsidies stop.
The New York Times’ The Upshot uses a percent stacked area chart to show how ACA marketplace premiums are split between what people pay and what the government covers at different income levels. The cutoff stands out visually, with support dropping sharply once income crosses the subsidy threshold. As you scroll, the same visual approach repeats to compare how the situation looked before the ACA, under the ACA rules, after the 2021 expansion, and in the current setup after those extra subsidies expired. The consistent format helps show how policy changes reshape the “cliff” over time.
Check out the article on The Upshot, by Irena Hwang, Josh Katz, and Margot Sanger-Katz.
ICE Detainee Transfers Across U.S.
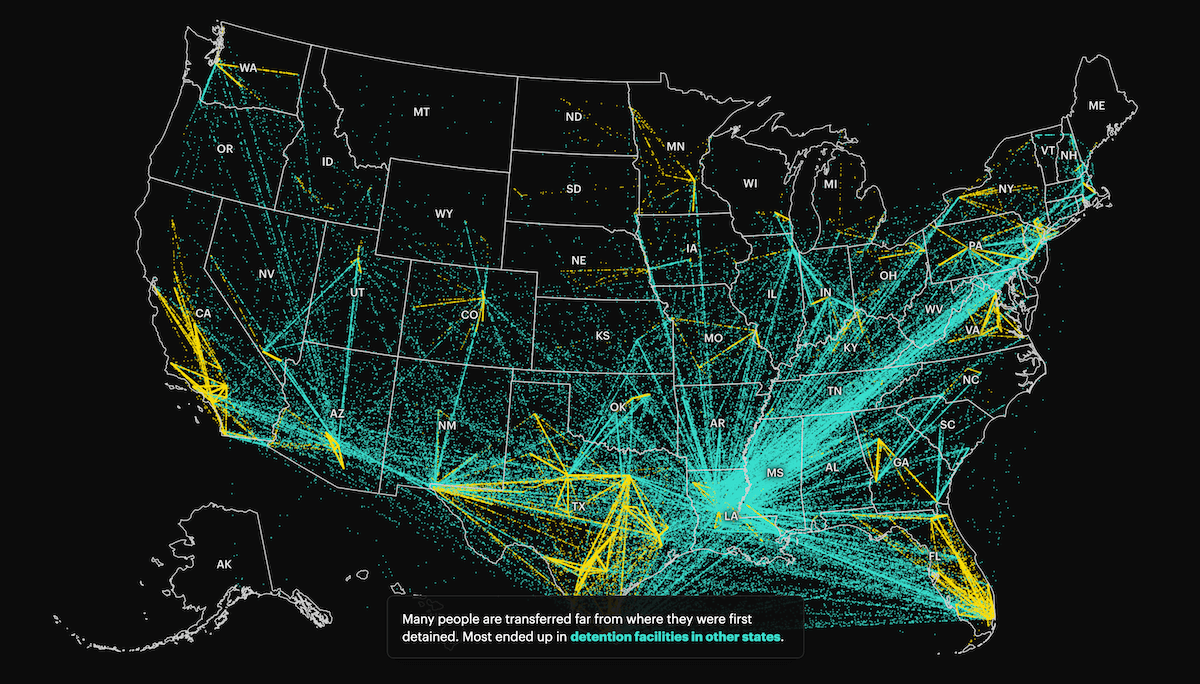
In 2025, Immigration and Customs Enforcement (ICE) detained hundreds of thousands of people across the United States. Many were moved between detention facilities and sent far from where they lived.
The Minnesota Star Tribune visualizes this movement with a dotted flow map based on ICE detention data. Each dot represents one person, and the scrollytelling animation traces the path from the first recorded lockup to the most recent recorded detention location. As you scroll, the map highlights how often people are transferred across state lines, with dots shifting from yellow to green to show those who ended up out of state. It then moves from the national view into closer looks at specific regions and Minnesota.
Explore the story on The Minnesota Star Tribune, by Yuqing Liu, Susan Du, and Christopher Magan.
Tariff Promises Versus Math
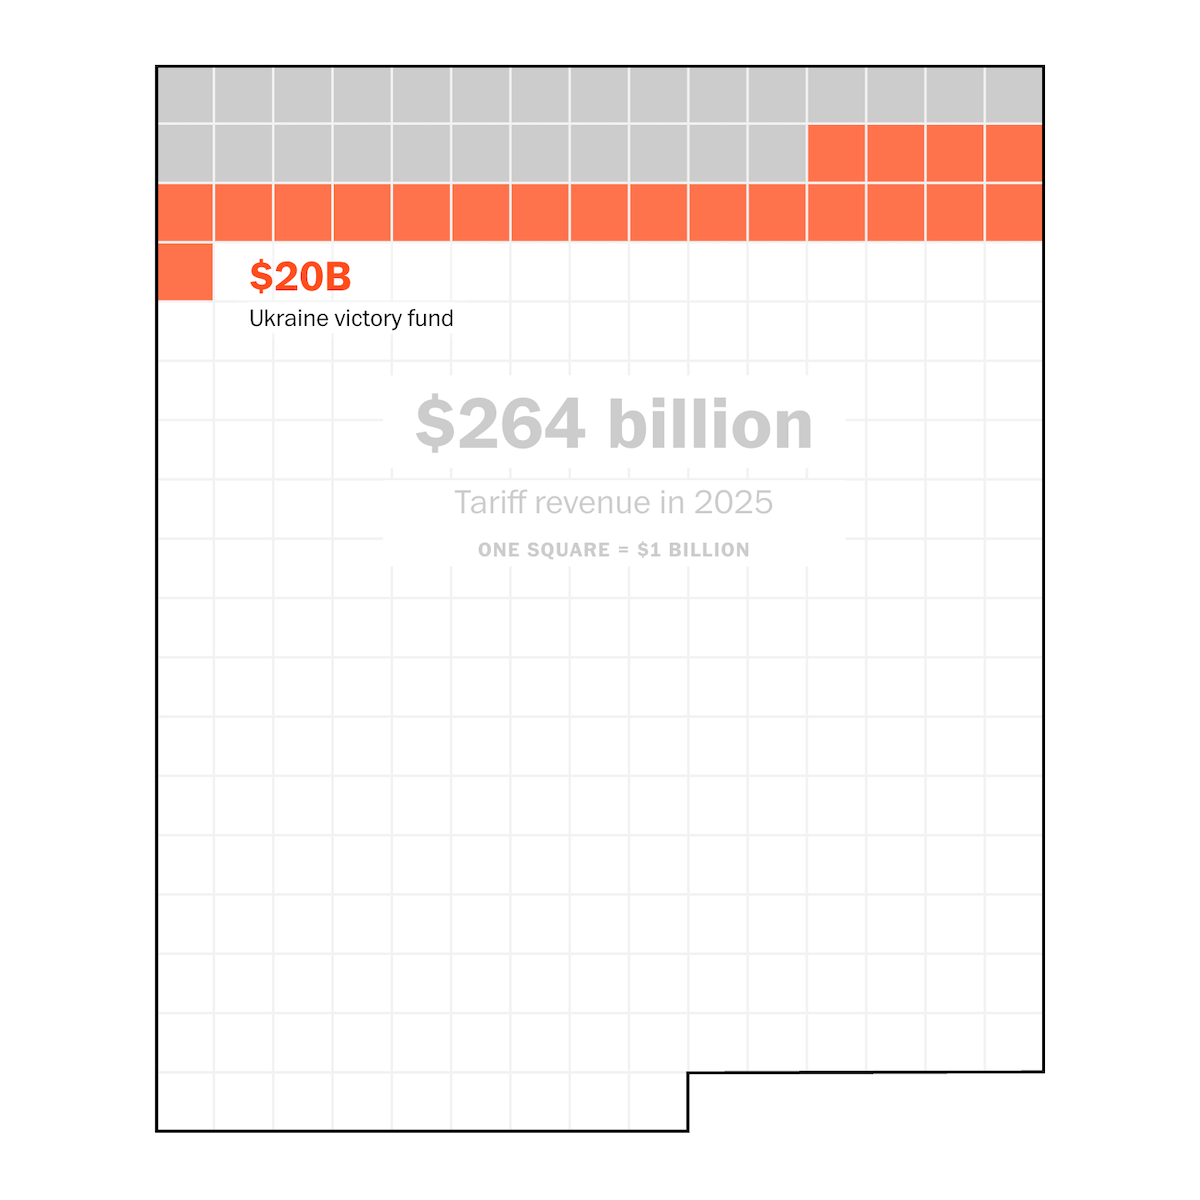
U.S. President Donald Trump has repeatedly said tariffs could help cover large new costs. But adding up the stated amounts shows a mismatch between the scale of the promises and the size of that revenue stream.
The Washington Post lays this out with a scroll-driven unit chart, drawing on tracking by the Cato Institute. The 2025 tariff revenue is shown as a block of squares, with one square representing $1 billion. As the story progresses, squares fill in to visualize each stated use for the money, moving from smaller items to larger ones until the running total extends well beyond the original block. The result is a simple visual tally that makes the gap easy to follow as it grows.
Take a look at the piece on The Washington Post Opinion section, from The Post’s Editorial Board.
Wrapping Up
These four pieces are a nice reminder of what visual data storytelling looks like when it is done well: the charts and maps are not decoration, they do real explanatory work.
Stay tuned for DataViz Weekly, where we keep rounding up recent data visualization work worth a look.
- Categories: Data Visualization Weekly
- No Comments »