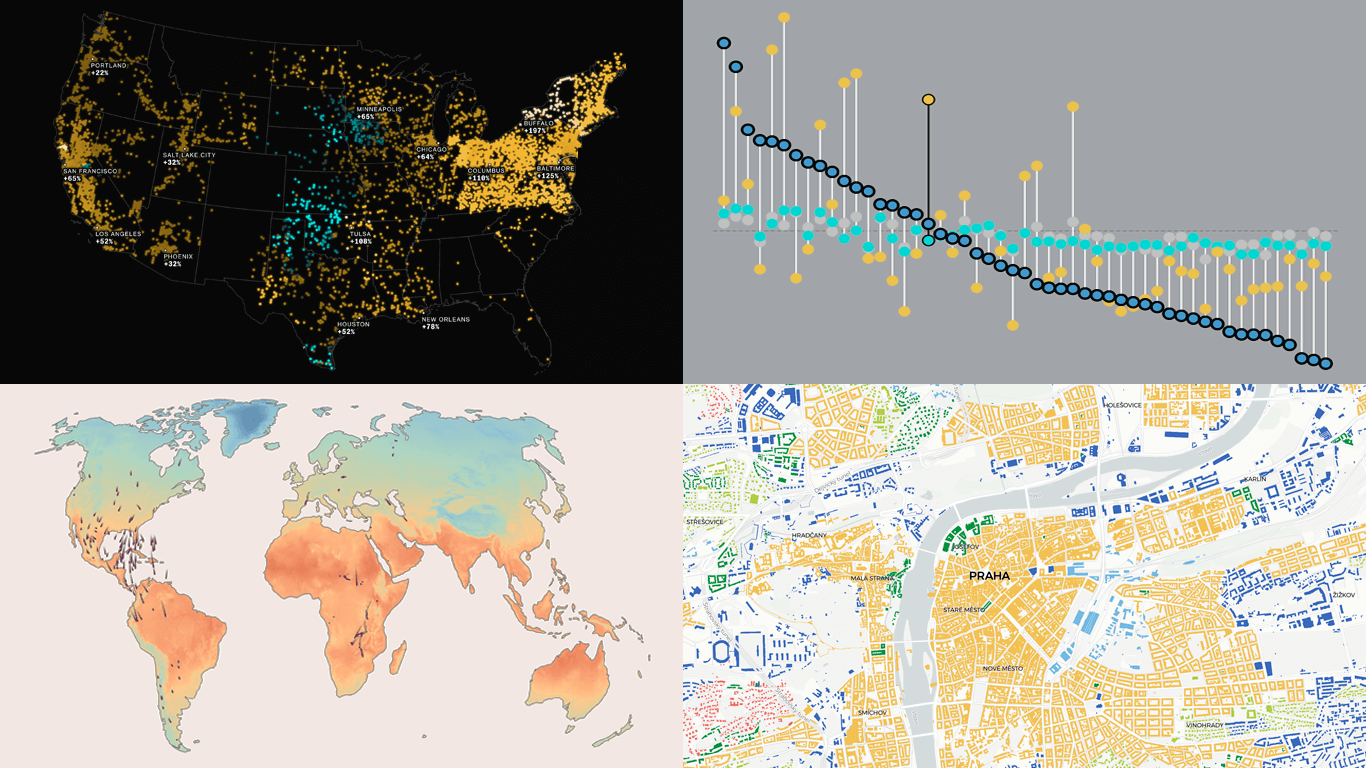
 Welcome back to DataViz Weekly, where we regularly observe how visualization helps bring data to life. This time, we invite you to take a look at the following projects that we have recently found particularly interesting:
- Bird journeys amid global warming — The Guardian
- Living costs across the United States — FlowingData
- Electricity prices across the U.S. in the AI era — The Big Take
- Urban patterns in Europe — Urban Taxonomy
Data Visualization Weekly: October 10–17, 2025
Bird Journeys Amid Global Warming
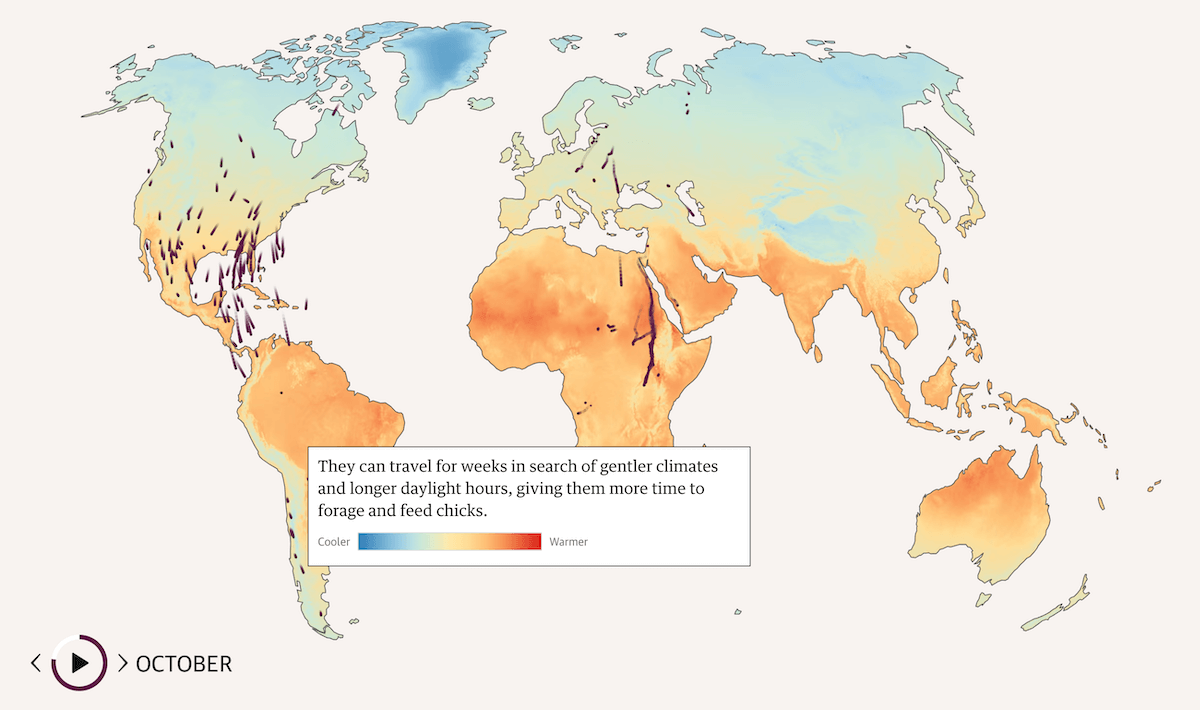
Every year, billions of birds trace vast routes across the planet, guided by shifting seasons and changing sources of food. These migrations depend on delicate conditions, from winds and daylight to fertile stopover sites, and are now being reshaped as the climate warms.
The Guardian visualizes how global warming is altering these ancient flyways through a series of animated maps and detailed bird profiles. Drawing on GPS data and environmental records, the project follows 45 species worldwide and tells the stories of three in depth: the storm-chasing Desertas petrel, the Sahara-crossing nightingale, and the Arctic-breeding Bewick’s swan. The visualizations layer flight paths with temperature and vegetation data to show how migration patterns shift with a changing planet.
See the article on The Guardian, by Phoebe Weston, Ana Lucía González Paz, Prina Shah, and Antonio Voce.
Living Costs Across United States
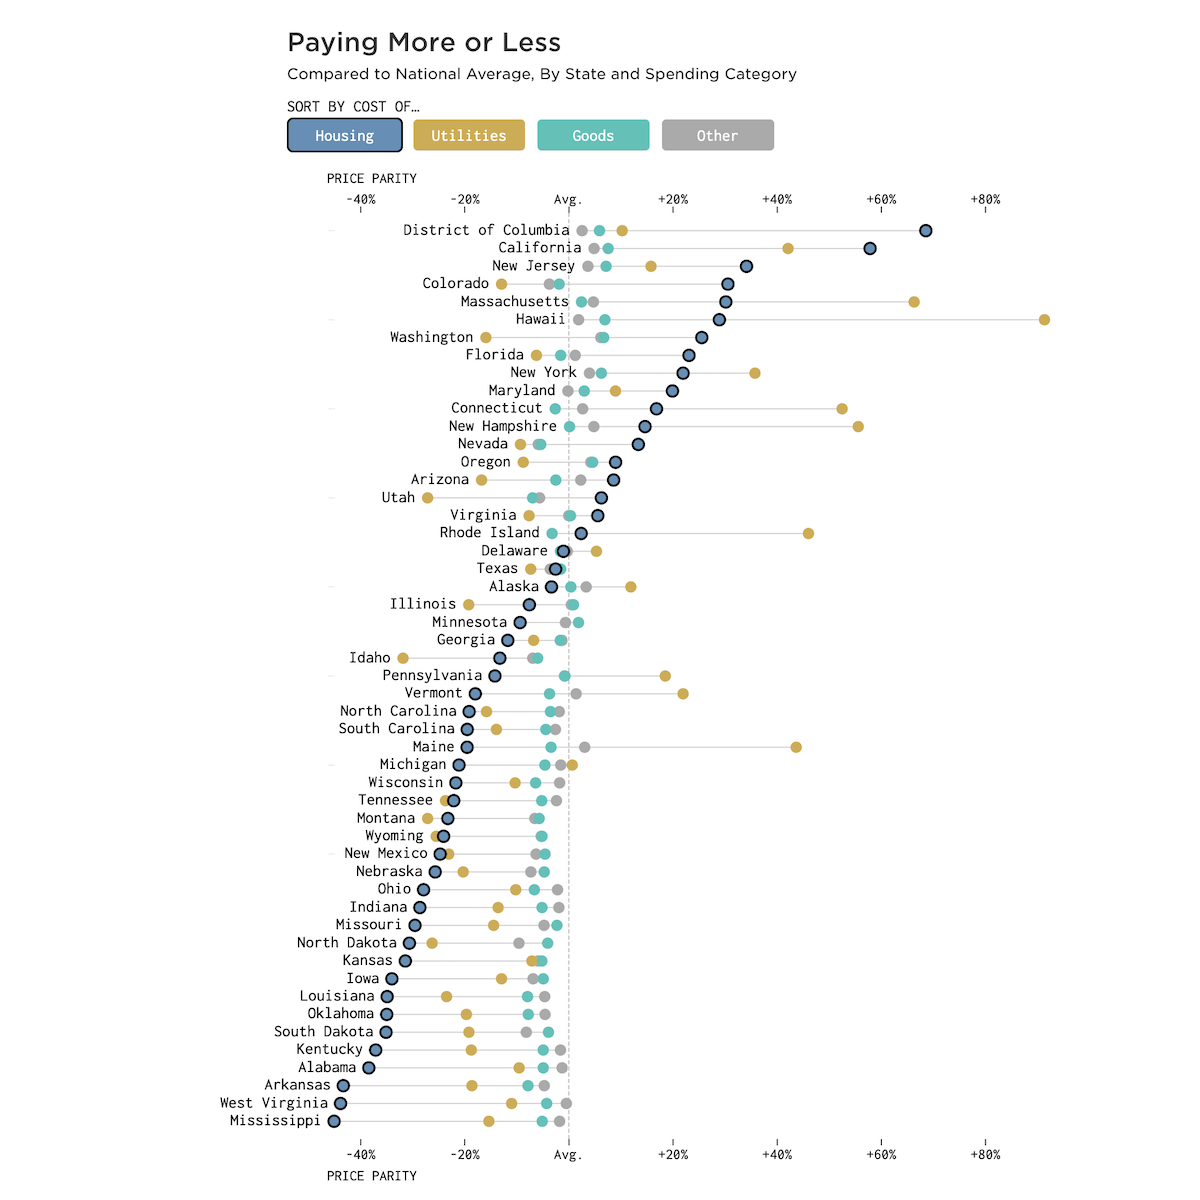
How much it costs to live in the United States depends on where you are. From one state to another, prices can differ greatly, making some places much more expensive than others.
Nathan Yau visualized 2023 regional price parity estimates from the Bureau of Economic Analysis in an interactive dot plot. The chart compares living costs in all 50 states and Washington, D.C., with the national average across four spending categories: housing, utilities, goods, and other. It can be sorted by category, making regional differences easy to spot. Housing and utilities create most of the contrast, with California and D.C. at the top and Mississippi and West Virginia near the bottom. Hawaii and Massachusetts stand out for utilities, while Texas and Delaware stay close to the midpoint across all groups.
Look at the project on FlowingData.
Electricity Prices Across U.S. in AI Era
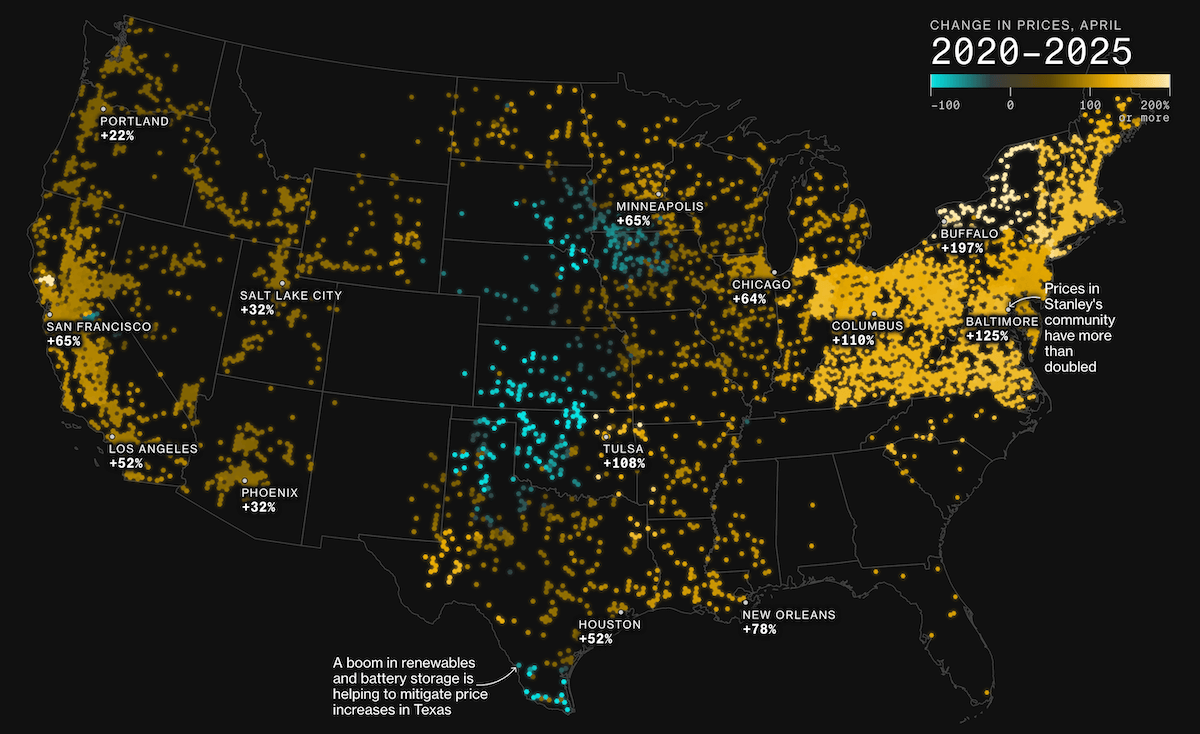
Electricity costs make up a significant share of living expenses and have climbed steeply across the United States over the past five years, in some places more than doubling. Yet, much like other everyday costs, the rise differs greatly from one region to another.
Bloomberg visualized how wholesale electricity prices have changed across the United States through a scroll-driven sequence of maps. The series begins with prices in April 2020, moves forward to April 2025, and then shows how much they have shifted in that time. The article itself explores how the boom in AI data centers is pushing up energy demand and driving higher power costs, and the final map leads naturally into that theme — highlighting areas within 50 miles of major data center activity, where more than 70% of recorded price increases occurred.
Check out the piece on Bloomberg’s The Big Take, by Josh Saul, Leonardo Nicoletti, Demetrios Pogkas, Dina Bass, and Naureen Malik.
Urban Patterns in Europe
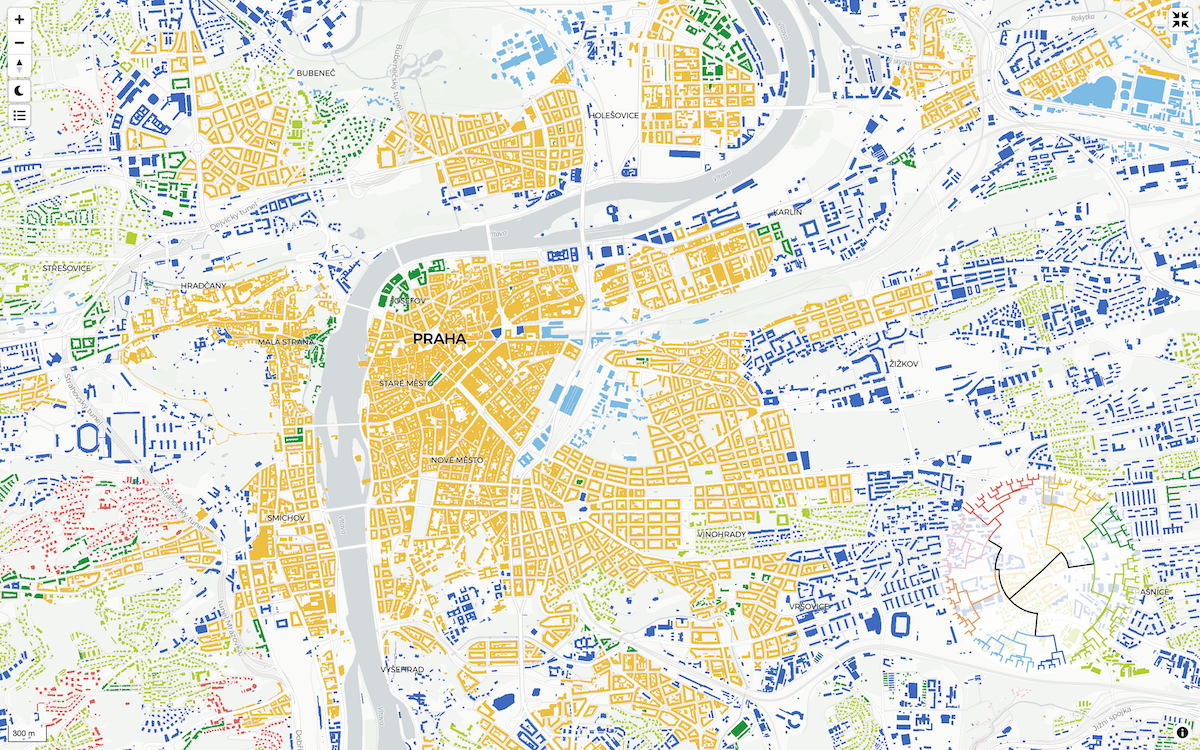
City layouts differ, but many follow recurring shapes and street patterns. Understanding these forms helps explain how cities are built and how different kinds of urban space relate to one another.
A team of researchers led by Martin Fleischmann and Krasen Samardzhiev from Charles University created Urban Taxonomy, a system that classifies built-up areas by their physical form. It divides cities into regions with similar building and street layouts and connects them through a branching taxonomy that shows how closely these regions compare. The classification now spans the built fabric of Austria, the Czech Republic, Germany, Lithuania, Poland, and Slovakia, with more countries to come. An interactive map lets users explore the hierarchy in detail: clicking a building reveals its category, and the taxonomy diagram can be used to filter and view related patterns across the map.
Explore the visual and learn more at urbantaxonomy.org.
Wrapping Up
Each week brings new examples of how visualization turns data into insight. We will continue to keep an eye on the most interesting work and share it here. Stay connected for more visual brilliance in the next edition of Data Visualization Weekly.
- Categories: Data Visualization Weekly
- No Comments »