The very first version of AnyChart hit the shelves more than 10 years ago, check out what our products went through and see what's new in the most recent update.
Version 7.x History
AnyChart version 7.14.4
Released Nov 16, 2017Changes:
- Fixed issues with xScale/yScale setting in typescript based projects
- Fixed rendering bugs in IE 6-8
- Rework CSV export
AnyChart version 7.14.0
Released May 31, 2017
Venn Diagram
Venn Diagram is the most powerful tool for visualizing the relations of sets. That said, this chart type allows for nicely displaying both the degree of the intersection of the sets and their nesting.- Take a look at Venn Diagram in the Gallery.
- Learn more about Venn Diagram in the Chartopedia.
- Check out Venn Diagram in the Documentation.

Tag Cloud (Word Cloud)
Tag Cloud (also known as Word Cloud, or Weighted List) is a form of data visualization that helps represent text data in a visually appealing way. It is especially widely used for displaying tags (keywords) in accordance with their relative prominence. Our solution for Tag Cloud allows for color scale based categorization, provides a lot of ways to arrange words by setting the allowed number of positions and angle intervals, and supports multiple interactivity settings.
Waterfall Chart
Waterfall Chart (or Mario Chart, Bridge Chart, or Flying Bricks Chart) is widely used for analytical purposes. In particular, this chart type facilitates the analysis of processes (sales, production, research, and so on), especially when it comes to exploring or communicating transitions between the stages in a process. Our Waterfall Chart solution stands out from the crowd by actually being able to get data both as absolute values for each state and as deltas (differences) between the states.- Take a look at Waterfall Chart in the Gallery.
- Learn more about Waterfall Chart in the Chartopedia.
- Check out Waterfall Chart in the Documentation.

Mekko Chart (Marimekko Chart) and Mosaic Chart
Mekko Chart (or Marimekko Chart) is a convenient means of visualizing sales of products from multiple categories, displaying the distribution of skills across jobs, and so on. Essentially it is close to the Stacked Column Chart type, but the latter shows only values within categories, whereas the Mekko Chart also displays the cumulative value of each category.- Take a look at Mekko Chart in the Gallery.
- Take a look at Mosaic Chart in the Gallery.
- Learn more about Mekko Chart in the Chartopedia.
- Learn more about Mosaic Chart in the Chartopedia.
- Check out Mekko Chart in the Documentation.
- Check out Mosaic Chart in the Documentation.

Bar Mekko Chart
Bar Mekko Chart is basically the same Mekko Chart but with several unique features. First, the Bar Mekko Chart allows for drawing trendlines. Second, it works great for including negative values. Finally, the Bar Mekko Chart looks more familiar to many people than the regular Mekko Chart.- Take a look at Bar Mekko Chart in the Gallery.
- Learn more about Bar Mekko Chart in the Chartopedia.
- Check out Bar Mekko Chart in the Documentation.

Quadrant Chart
Quadrant Chart is a simple and at the same time amazingly convenient and efficient tool for prioritizing and categorizing discrete data. Our solution offers all necessary features and allows for successfully solving various popular tasks such as Categorization of scattered data, BI Services Comparison, Eisenhower Matrix, SWOT Analysis, and so on.- Take a look at Quadrant Chart in the Gallery.
- Learn more about Quadrant Chart in the Chartopedia.
- Check out Quadrant Chart in the Documentation.

Google Spreadsheets data loader
Google Spreadsheets is an excellent popular data source. And now our Data Adapter is equipped with the capabilities to load data from there. Feel free to make good use of the Google Spreadsheets data loader, and please note: data may be taken from publicly shared documents only.- Take a look at Google Spreadsheets data loader in the Gallery.
- Check out Google Spreadsheets data loader in the Documentation.

Marquee Select and Zoom tools
Marquee Select and Zoom tools work great to facilitate the exploratory data analysis. They make the research of data visually represented on an interactive chart even more convenient and intuitive. What's also important is that our Marquee Select and Zoom tools may be integrated with any custom UI by means of events:- Check out Marquee Select in the Documentation.
- Check out Marquee Zoom in the Documentation.

Scale sync feature
Scale Sync is helpful in the situations when you have to represent diverse data on a single visualization. Use it to avoid a visual mess and to prevent such a complex chart from misleading the viewer. Indeed, when the scales are synchronized, you can even add stacking and still get a good-looking, useful chart at the end.- Take a look at Scale sync feature in the Gallery.
- Check out Scale sync feature in the Documentation.

Text Wrap "byWord" feature
By popular request, Text Wrap is now supported in all charting elements that contain texts. This text formatting feature will make sure that every output text is absolutely print-friendly.- Take a look at Text Wrap feature in the Gallery.
- Check out Text Wrap feature in the Documentation.
Improvements:
- Stackoverflow Added getLabel() method which can be used to to customize individulal axis labels settings
- TS-91, TS-92 Method anchor() now accepts "auto" value, which make auto adjust of data points labels position anchor.
Bug fixes:
- TS-108 — Fixed compatibility issues with ExtJS, which occurred due to incorrect polyfill usage
- TS-63 — Fixed issues with incorrect tooltip width auto-calculation
- TS-32, TS-49 — Fixed issues with import in Aurelia and Angular 2 frameworks
- TS-77 — Fixed error with rendering rotated text in IE8
- TS-103 — Fixed Firefox gradient issues
- TS-38 — Fixed bug with overlapMode method in Pie Chart
- DVF-2216 — Fixed issues with attach() method in ContextMenu
- DVF-2303 — Fixed bug with incorrect drawing of inverted x-axis
AnyChart version 7.13.1
Released April 11, 2017
Polar based Charts Types
Six new Chart Types are now available in AnyChart:- Polyline Polar Chart
- Polygon Polar Chart
- Column Polar Chart
- Range-Column Polar Chart
- Stacked Polygon Polar Chart
- Stacked Column Polar Chart

Angular 2 plugin
We are happy to announce the release of the AngularJS v2.x directives for AnyChart.
Labels improvement:
- One of the biggest topic of this release is Labels Improvement, we have done a great job to make the work with the component more convenient and intuitive.
- Data labels settings for all chart series now can be set using single method chart.labels
- Context object for all formatting functions is now unified, see anychart.format.Contextfor details.
TypeScript support:
- Now you can use AnyChart in your TypeScript projects — we have definition file for our library which you can find in distribution folder.
Improvements:
- Added new .vertical() constructor for vertical charts.
Bug fixes:
- DVF-2774 — Fixed issues with reset themes.
- DVF-2818 — Fixed point events on iOS in Pie Chart.
- DVF-2804 — Fixed issues with data view and set method.
- TS-19 — Fixed issues with AnyChart Fonts.
API changes:
AnyChart version 7.13.0
Released February 28, 2017
AnyChart in Now Open
Reliability has always been our company"s first priority. And you definitely know you can trust us, with our public roadmaps, consistent releases, and highly experienced Quality Assurance team. Today we are glad to tell you about another major step that we have just taken in this regard: AnyChart is now open! Basically, it means the following:- The Source code of our product is available for review and download on GitHub.
- The public issues tracker is open to all who are ready to help us further improve our product.
- Public Build scripts allow you to compile custom binaries with the chart types you need.
- The open brancheslist demonstrates our development cycle and proves you can trust us.


Sharing
Now any chart can be shared on social networks with the help of the context menu. Properties specific to a particular social network can be set in the exports namespace.- Check out Sharing Charts in the Documentation.

Vertical Charts
Most of the series are now available in the vertical orientation with the help of the isVertical() method. We have also added special constructors for the most popular vertical chart types, verticalArea() and verticalLine().- Take a look at Vertical Charts in the Gallery.
- Check out Vertical Charts in the Documentation.

Pareto Chart
Pareto Chart is a new arrival in the set of chart types supported in AnyChart. Named after prominent economist and sociologist Vilfredo Pareto, it is one of the most popular chart types in the field of management. Now you can easily create a Pareto chart using the anychart.pareto() constructor.- Take a look at Pareto Chart in the Gallery.
- Check out Pareto Chart in the Documentation.

Step/Stick/Jump line Charts
The Step Line Forward and Step Line Backward modifications of the Step chart are now available with the help of the stepDirection() method. We have also added the Jump Line Chart and the Stick Chart that can be added using the jumpLine() and stick() methods.
Custom Series Drawing
Now you can use the new rendering() method to put any creative idea into action and create custom charts like Frog Chart, Cherry Chart, or Column Chart with Rounded Edges.- Take a look at Custom Series Drawing in the Gallery.
- Check out Custom Series Drawing in the Documentation.

Legend
In this release, we are glad to present several major legend features.- The itemsLayout() now supports new options that allow you to improve the legend's visual appearance, especially when multiple series are shown on a chart.
- The legend can now be placed inside a data plot (the positionMode() method) to facilitate a more efficient use of space on a chart.
- The drag() method is a pleasant addition to the preceding two features. It allows you to easily change the chart legend's position by simply dragging it throughout a chart.
- Check out Legend features in the Documentation.
Bug fixes:
- DVF-1664 — Marker stroke thickness fixed.
- DVF-1733 — Legend Interactivity issues fixed.
- DVF-1749 — Issues with epy disappearing tooltip fixed.
- DVF-2021 — xScroller issues fixed.
- DVF-2407 — Various gauge issues fixed.
- DVF-2432 — Issues with excluding error series fixed.
- DVF-2442 — Stack Mode issues fixed.
- DVF-2590 — Various error series issues fixed.
- DVF-2595 — TextFormatter issues fixed.
- DVF-2607 — Issues with tooltip in range series fixed.
- DVF-2626 — Animation issues fixed.
- DVF-2646 — Issues with the marker positioning fixed.
- DVF-2613 — Added new settings to Linear Gauge chart.
- DVF-2620 — Issues with default Heatmap marker coloring fixed.
- DVF-2643 — Default tooltip formatters in several charts improved.
- DVF-2659 — Tooltip drawing algorithm improved.
- SUP-706 Issue with legend marker in Column chart fixed.
- SUP-711 Issue with memory leak in StockChart fixed.
- DVF-1397 Fixed issue with title positioning.
- DVF-1829 Legend item issues fixed.
- DVF-2274 Legend sizing issue fixed.
- DVF-1449 Fixed issues with shared legend.
- DVF-2606 Legend item issue fixed.
- DVF-2318 Issues with series unhovering fixed.
- DVF-1746 Various minor legend issues fixed.
- DVF-2619 Downloading logo.png issues fixed.
- DVF-2637 Default timezone settings fixed.
API changes:
| Method | Version and Date | Use instead |
|---|---|---|
| anychart.cartesianChart | deprecated since 7.4.0, March 2015 | anychart.cartesian |
| anychart.areaChart | anychart.area | |
| anychart.barChart | anychart.bar | |
| anychart.bulletChart | anychart.bullet | |
| anychart.columnChart | anychart.column | |
| anychart.financialChart | anychart.financial | |
| anychart.lineChart | anychart.line | |
| anychart.pieChart | anychart.pie |
AnyChart version 7.12.0
Released October 31, 2016
Localization Support
One of the main news of this release: support of localization using locale settings files and special formatting functions. You can switch between 196 different regional settings, and all date/time chart elements update themselves.- Check out Localization Support in the Documentation.

Standalone Chart Elements
Now you can use all chart building blocks, such as scales, axes, legends and so on to build your own charts and dashboards. Use this feature along with AnyChart's GraphicsJS graphics library, and you will be able to create your own unique charts and visualizations.- Check out Standalone Chart Elements in the Documentation.

Tooltip settings Improvement
API for tuning chart and series tooltips is improved. These changes allow to make your applications simpler, leaving room for flexibility as well.- Check out Tooltip Settings Improvement in the Documentation.
Bug fixes:
- DVF-2466 — Problems with the serialization of Circular Gauge settings to JSON/XML fixed.
- DVF-2339 — Problems with animation interfering with chart display fixed.
- DVF-2436 — Minor problems with points select process fixed.
AnyChart version 7.11.1
Released August 30, 2016Improvements:
- DVF-2119 — Legend width/height behavior improved.
- DVF-2362 — Scatter Series behaviour made consistent with other series.
- DVF-2261 — Credits behaviour improved.
- DVF-2346 — appendTheme() method added for easier management of themes.
- DVF-2079 — Beta version of the Data Adapter Module added for easier management of external files.
- DVF-2307 — Export Server can now return images as base64 strings or as shareable links.
- DVF-2268 — Circular Gauge Ranges and Axis Bar can now be properly rounded.
Bug fixes:
- DVF-2352 — XML Schema validity problems fixed.
- DVF-2360 — Various minor Export Server issues fixed.
- DVF-2358 — Various minor Interactivity issues fixed.
- DVF-2376 — Inconsistent zIndex behaviour fixed.
- DVF-2338 — Various XML serialization/deserialization fixed.
- DVF-2337 — Various JSON serialization/deserialization fixed.
- DVF-2327 — toXML() deserialization method no longer adds unnecessary data into XML.
- DVF-2055 — Pie events fixed.
- DVF-1759 — Funnel chart label placement algorithm fixed.
- DVF-2246 — Series on/off problems fixed.
- DVF-2013 — 3D Chart events fixed.
- DVF-2345 — Context Menu in Linear Gauges fixed.
- DVF-2320 — Series Legend Interactivity issues fixed.
- DVF-2381 — Seat Map labels fixed.
- DVF-2088 — Legend Interactivity issues fixed.
- DVF-1984 — Issues with Ordinal Axis Labels fixed.
- DVF-2272 — Circular Gauge Gradient display issues fixed.
- DVF-2335 — Tree Map coloring issues fixed.
- DVF-2309 — Range Marker issues fixed.
AnyChart version 7.11.0
Released Jul 27, 2016
Full accessibility support (section 508)
All AnyChart charts now support AAA-level web accessibility standards (Section 508) using very flexible a11y (accessibility) features. AnyChart supports two accessibility modes:- The Data Table mode creates a hidden HTML Table with chart data that is available to all screen readers.
- The Chart Elements mode adds special accessibility attributes (ARIA tags) to the elements of the chart, making the elements readable by screen readers.
- Check out Accessibility Support in the Documentation.

Linear Gauges
We have created a very flexible way of building any type of Linear Gauges. You can use built-in constructors for LED, Tank, and Thermometer Gauges or build your own Gauge with simple configurations.- Take a look at Linear Gauges in the Gallery.
- Check out Linear Gauges in the Documentation.

Chart Editor
We are happy to announce the Chart Editor feature which makes the integration of AnyChart much easier. Chart Editor is a dialog window that allows to create and set up various chart types. The result can be saved with fixed data in XML or JSON format or in a reusable format with a JavaScript code string.- Check out Chart Editor in the Documentation.

Async Rendering
The Async Rendering feature allows you to make web pages and applications with a big number of charts more responsive during the page loading process.- Check out Async Rendering feature in the Documentation.
Improvements:
- DVF-2268 — New feature for Circular Gauge axes and range markers — corners rounding.
- DVF-2272 — Linear gradient in Circular Gauge range markers now follows the curvature of the marker.
Bug fixes:
- DVF-427 — Improved Area and StepArea series appearance in stacked scale mode.
- DVF-2247 — Improved token-based formatting involving numbers scaling.
- DVF-2260 — Fixed export server crashing on inputs with cursor property defined.
- DVF-2262 — Improved 3D Pie appearance.
- DVF-1627 — Fixed some printing issues in Internet Explorer and Microsoft Edge.
- DVF-2259 — Fixed series labels failed to appear if turned on after chart draw.
- DVF-2287 — Fixed an issue with stacked scales in Radar chart.
AnyChart version 7.10.1
Released May 31, 2016Bug fixes:
- DVF-2170 — Solved compatibility issues between AnyChart UI and other AnyChart products.
- DVF-2017 — Solved compatibility issues with old versions of ExtJS (3.4 and less).
- DVF-2167 — Fixed bug with chart scroller and continuous series.
- DVF-2017 — Fixed bug with tooltips in TreeMap Chart.
AnyChart version 7.10.0
Released Apr 27, 2016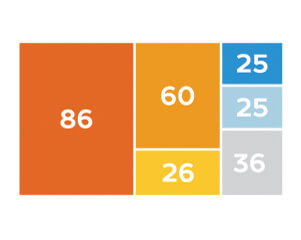
TreeMap Chart
We are happy to announce that we have added one of the best chart types for showing hierarchical data — TreeMap Chart. It has all the features allowing to create treemap-based solutions: Drill-Down API, Flexible Interactivity Settings, Hint Depth Feature, and smart Labels/Headers display modes. Hierarchical Data Engine allows to add, alter, and search hierarchical data sets.- Take a look at Take a look at TreeMap Chart in the Gallery in the Gallery.
- Check out TreeMap Chart Chart in the Documentation.

Themes
To make it easier to integrate AnyChart Charts in your website or application, and to help you to choose matching colors, we present you with 18 out-of-the-box themes. These themes are based on 13 color palettes, which can be used with or without the themes. You can change or use themes how you like, attuning them to your requirements.- Check out Themes in the Documentation.
Save as Excel/CSV/XML/JSON
We have extended our Export API. Now you can not only export your chart as an image or PDF, but also grab data or configuration settings with these four new methods:- saveAsCsv — saves chart data sets in CSV (Comma-Separated Values) format
- saveAsXlsx — saves chart data in Excel (.xlsx) format
- saveAsXml — saves chart configuration settings as XML (which may be particularly useful in conjunction with the anychart.toXml and anychart.fromXml methods)
- saveAsJson — saves chart configuration settings in JSON format (this method is similar to saveAsXml and is used along with the anychart.fromJson and anychart.toJson methods)
- Check out Export functions in the Documentation.

Chart Statistics
By popular request, we have made the getStat method available outside of TextFormatter functions : now you have access to statistical data that AnyChart engine calculates any time you want. Please note that you can use statistical data to fine-tune your visualisation or highlight some data points and that it can be done before the chart is drawn- Check out Chart Statistics in the Documentation.
Context Menu
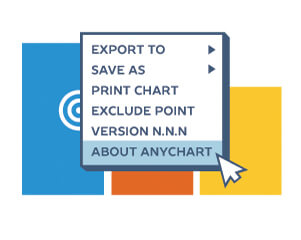
Context menu now comes out-of-the-box too. By default, it provides Print, Export, and other commonly used items. You can add your own elements or remove default ones; context menu look is customizable too.- Check out Context Menu in the Documentation.
Keep/Exclude Data Point
Exclude/Include Points API and ability to use this API in the context menu allows you and any chart viewer to hide some parts of the chart. You can create complex data mining applications that show more information and make it easier to understand.- Check out Keep only/Exclude Data Point in the Documentation.

3D Charts Improvements
For those of you who like to use 3D charts, we've added the Z-Axis Distribution option, animations, and the ability to use hatch fill.Improvements:
- DVF-2001 — Axes and Grids API Imrovement.
Bug fixes:
- DVF-1512 — Solved issue with tooltips being cut when display resolution is high.
- DVF-1812 — Minor theme issues solved.
- DVF-1840 — Hover issues solved in Pyramid charts.
- DVF-1843 — XML/JSON serialization issues fixed.
- DVF-1848 — chart.tooltip().hide() and anychart.utils.hideTooltips methods added to help with complex tooltip issues, tooltip disposing is improved.
- DVF-2072 — Legend marker bug fixed.
- DVF-2120 — base tag breaking scroller clip rectangle issue solved.
AnyChart version 7.9.1
Released Feb 18, 2016Bug fixes:
- DVF-1979 — Solved issues with PDF export function.
- DVF-2000 — Fixed bug with Linear Scale and Scroller in Cartesian charts.
- DVF-2005 — Solved issues with coloring in HeatMap Charts in 6.x Theme.
AnyChart version 7.9.0
Released Jan 27, 2016

3D Area Chart
We are very proud that we have succeeded to create such a beautiful 3D Area chart. Just as in the case of 3D Bar/Column Charts, you can adjust the angle and depth using the zAngle and zDepth methods.- Take a look at 3D Area Chart in the Gallery.
- Check out 3D Area Chart in the Documentation.
String Tokens
The String Tokens feature is an alternative to formatting text in labels and tooltips using formatting functions. Unlike functions, String Tokens are much more convenient in simple cases. They provide more flexibility in terms of settings serialization and are more familiar to the customers that have been using our Flash-based components.- Check out String Tokens in the Documentation.
Migration Tool
Migration Tool is a small JavaScript library with an open source code, which is aimed to facilitate the transition from AnyChart 6 to AnyChart 7. Its main function is converting AnyChart 6 XML/JSON settings to AnyChart 7 settings. This library also contains special functions for partial conversion and creating custom converters.
Performance Improvement
In this release we have significantly improved performance: the number of points that can be displayed in less than a second has increased from 3000 to 10000. However, it is not the limit of AnyChart capabilities. Every release contains performance improvements, and we are not going to stop!- Take a look at Benchmark Page in the Gallery.
Bug fixes:
- DVF-1446 — Fixed an error with setting offsetX and offsetY in point tooltips using string values.
- DVF-1469 — Fixed an error occurring when the stack mode of Y-axes was changed dynamically.
- DVF-1729 — Fixed an error causing the legend to disappear when exporting charts to PNG, JPG, and PDF in IE 9-11.
- DVF-1781 — Fixed an issue with server-side rendering when setting image size in pixels.
- DVF-1786 — Fixed an issue with the toJson and fromJson methods in Cartesian Charts.
- DVF-1798 — Fixed an error with displaying tooltips for missing points.
- DVF-1799 — Fixed an error that caused visual artifacts when scrolling along the X-axis.
- DVF-1816 — Fixed an error with displaying tooltips in Safari 5.x and earlier versions.
- DVF-1824 — Fixed an error in Circular Gauges when setting negative values for Bar Pointers.
- DVF-1827 — Fixed an error with tooltips in Sparkline Charts.
- DVF-1835 — Fixed an issue with the container method when moving a chart from one DIV to another.
- DVF-1851 — Fixed an error causing the Crosshair to disappear when axes were disabled in Cartesian Charts.
- DVF-1864 — Fixed issues with displaying HeatMap Charts when the selected field was set in data.
AnyChart version 7.8.0
Released Nov 3, 2015
Heat Map Chart
A graphical representation of data where the individual values contained in a matrix are represented as colors.- Take a look at Heat Maps in the Gallery.
- Check out Heat Map Chart in the Documentation.
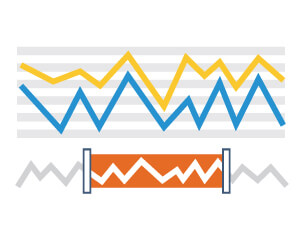
Zoom and Scroll
Scroller allows you to show more .- Take a look at Scroller Feature in the Gallery.
- Check out Scroller Feature in the Documentation.
Improvements:
- DVF-410 — String, Date/Time and Number text formatting helper functions added.
- DVF-1731 — Event objects in Point listeners got improved structure and now easier to use.
- DVF-1760 — defaultSeriesType, id, addSeries, removeAllSeries, getSeries, getSeriesAt, removeSeries, removeSeriesAt, getSeriesCount methods added for easy series management.
AnyChart version 7.7.0
Released Sep 29, 2015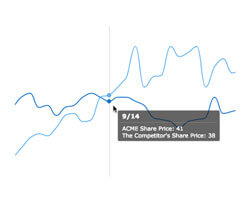
ByX interactivity mode
ByX interactivity mode highlights all data points with the same X axis value.- Take a look at ByX interactivity mode in the Gallery.
- Check out ByX Interactivity Mode in the Documentation.
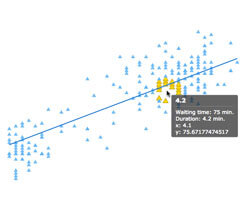
BySpot interactivity mode
BySpot interactivity mode highlights points falling into the defined radius.- Take a look at BySpot interactivity mode in the Gallery.
- Check out BySpot interactivity mode in the Documentation.
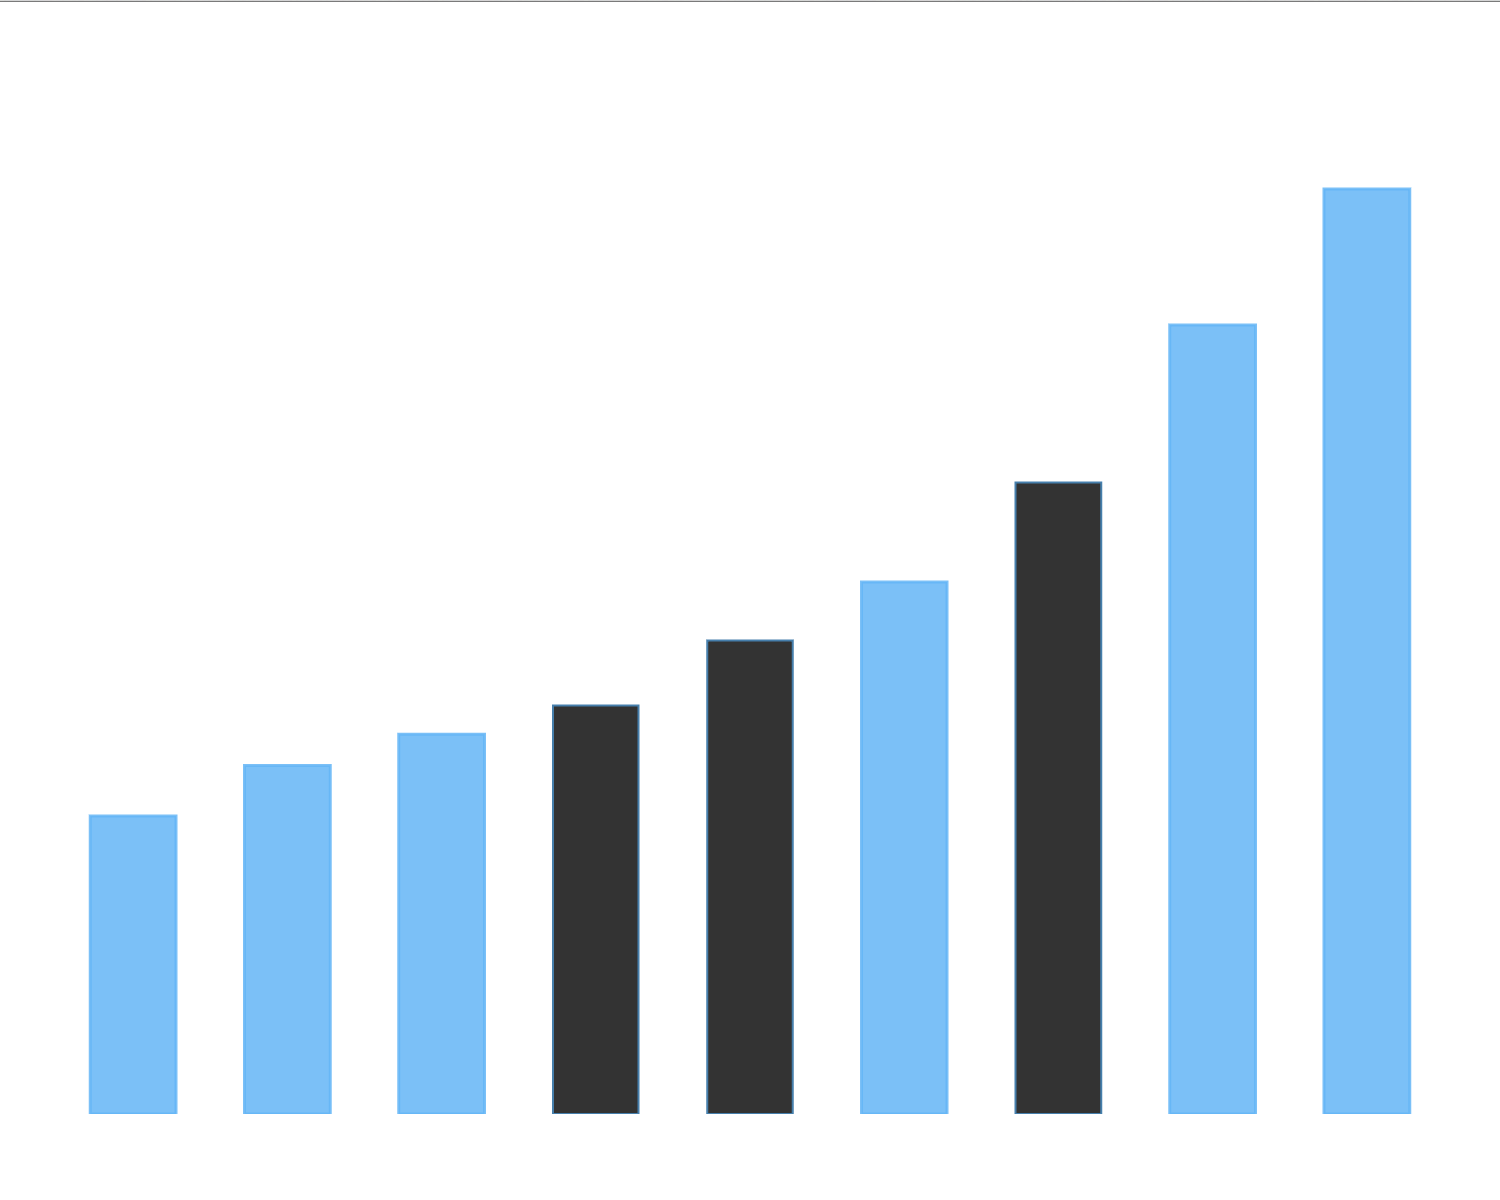
Select and Multi-Select
Ability to select and multi-select data points is essential for complex dashboards, implementing drill down or creating interaction between chart and other UI elements.- Take a look at Select and Multi-Select Sample in the Gallery.
- Check out Select and Multi-Select in the Documentation.
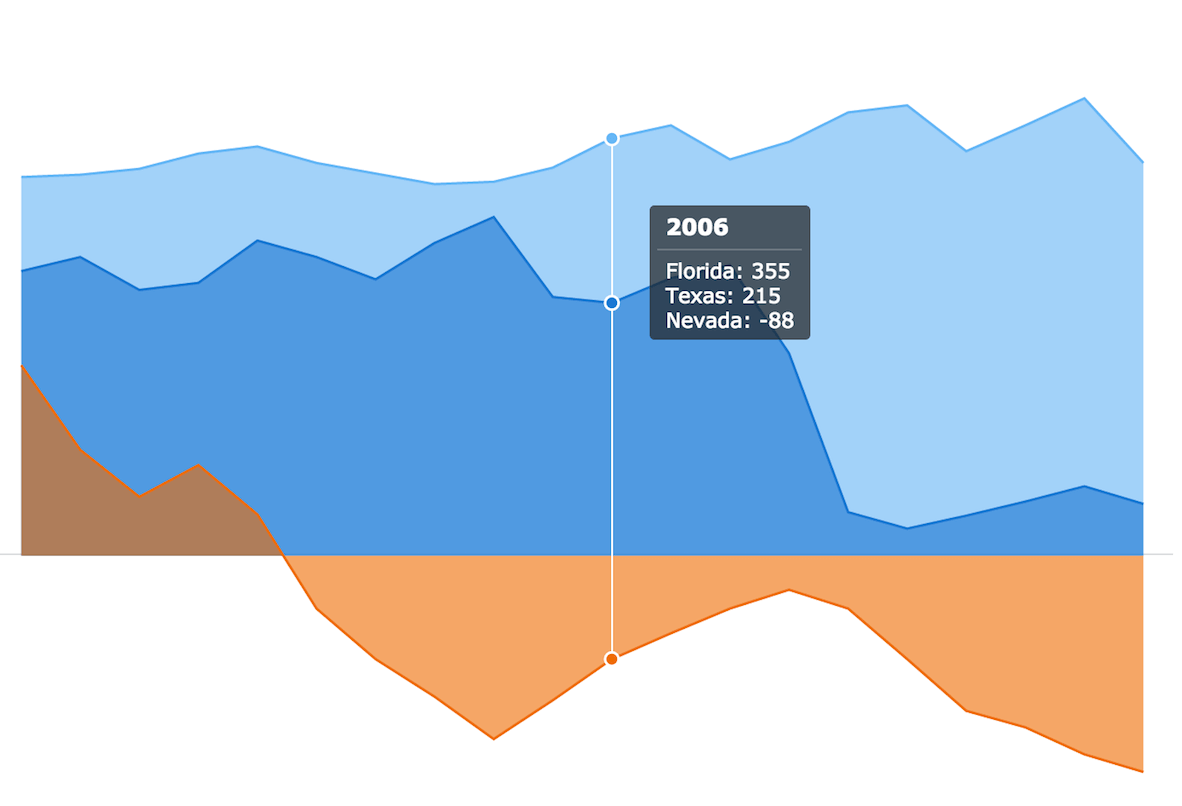
Union Tooltip
Union tooltip mode to display information from several series in one tooltip. Useful when comparing data in multi-series charts.- Take a look at Union Tooltip Sample in the Gallery.
- Check out Union Tooltip in the Documentation.
Separate Tooltip
Separate tooltip mode to show several tooltips at once in multiseries charts.- Take a look at Separate Tooltip Sample in the Gallery.
- Check out Separate Tooltip in the Documentation.
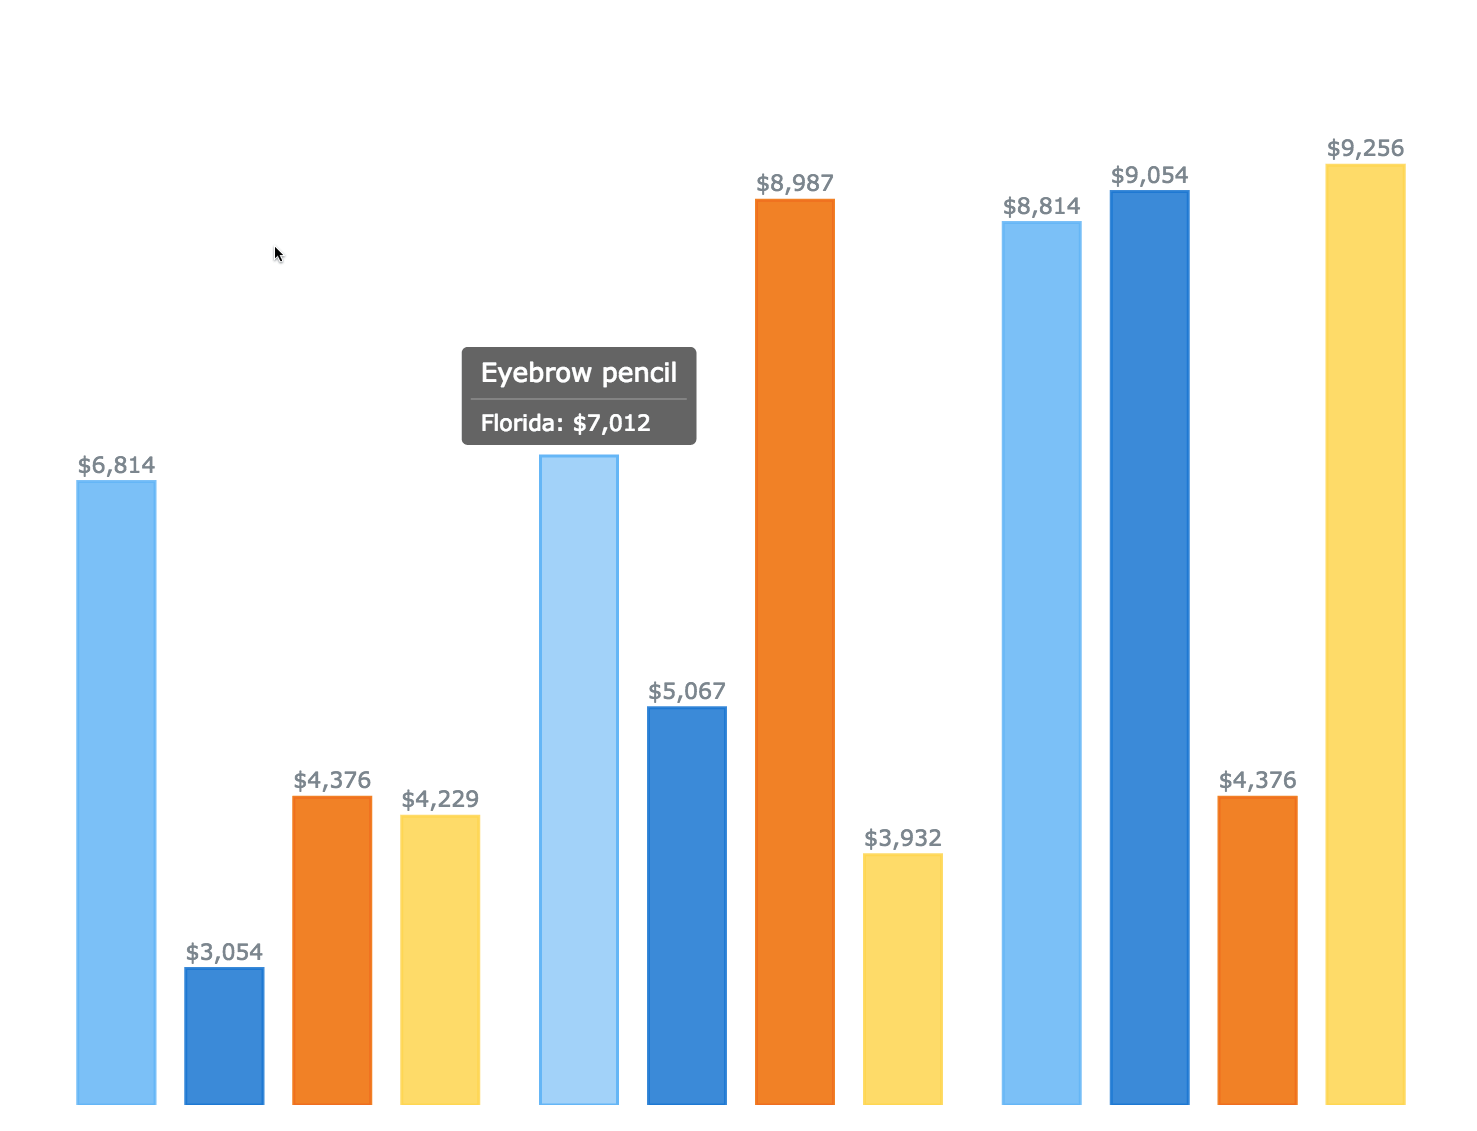
Point Tooltip Position
Point tooltip position to set fixed tooltip position next to a data point.- Take a look at Point Tooltip Position Sample in the Gallery.
- Check out Point Tooltip Position in the Documentation.
Chart Tooltip Position
Chart position mode to set fixed tooltip position inside a chart area.- Take a look at Chart Tooltip Position Sample in the Gallery.
- Check out Chart Tooltip Position in the Documentation.
Improvements:
- DVF-1292 — Tooltips in Gauge and Sparkline charts.
- DVF-1467 — Refactored text processing for Firefox browser.
- DVF-1660 — Added extra fields into maps' tooltip formatter
- DVF-1663 — Set palette as an array option.
- DVF-1440 — Refactored palettes API (items() and itemsAt() methods added. colors(), colorAt(), hatchFills() and hatchFillsAt() methods are marked as deprecated).
- DVF-1517 — iconSize() method added in legend, items width problem solved.
Bug fixes:
- DVF-1094 — Problem with setting container several times solved.
- DVF-1353 — Bug with background overlapping buttons in DataGrid fixed.
- DVF-1354 — Problem with formatters deserialization solved.
- DVF-1371 — Problem with setting names in a scale after chart draw call solved.
- DVF-1376 — Marker series hover fill problem solved.
- DVF-1386 — Hatch fills deserialization problem solved.
- DVF-1387 — Bug with hovered labels background fixed.
- DVF-1396 — Problem with markers disappearing when chart data is adjusted after chart draw solved.
- DVF-1419 — Bug with hatch fill redrawing when data for pie chart was adjusted after chart drawing fixed.
- DVF-1451 — Problem with radar chart missing points solved.
- DVF-1457 — Bug with Funnel Chart wrong labels position in Firefox browser fixed.
- DVF-1479 — Wrong marker hovering in radar charts fixed.
- DVF-1481 — Problems with opacity calculation solved.
- DVF-1483 — Stage rendering problems solved.
- DVF-1500 — Sparklines appearance bugs fixed.
- DVF-1518 — Pie chart overlapping legend problem solved.
- DVF-1525 — Problem with hovering out of range points solved.
- DVF-1534 — Legend title size bug on chart resize fixed.
- DVF-1564 — Bug with disappearing bullet chart markers fixed.
- DVF-1611 — Problems with jQuery and multiple charts on one page solved.
- DVF-1635 — Bug with altering themes defaults fixed.
- DVF-1644 — Problems with drawing chart into a hidden container solved.
- DVF-1645 — Problem with extra resizes when chart container is hidden solved.
- DVF-1646 — Bugs with data adjustment after chart draw fixed.
- DVF-1647 — Multiple problems with a wrong data processing for pie chart (grouping data, sorting data, etc.) solved.
- DVF-1648 — Problems with polar chart adjustments after drawing solved.
- DVF-1649 — Bugs with grid appearance in radar and polar charts fixed.
- DVF-1650 — Bug with custom grid colors in scatter charts fixed.
- DVF-1651 — Bug with adjusting sparkline data after chart drawing fixed.
- DVF-1656 — Bug with legend title cropping fixed.
- DVF-1661 — Bug with extra space for disabled labels in pie chart fixed.
- DVF-1710 — Found a workaround to overcome current Microsoft Edge bug with SVG texts rendering.
- DVF-1716 — Fixed a bug with labels positioning in Pie chart with single non-zero point.
AnyChart version 7.6.0
Released Aug 3, 2015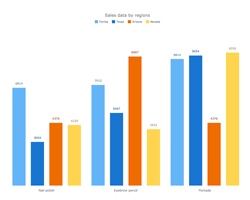
New Look and Theming
All AnyChart charts got the new modern look and design, we worked hard to make everything even more aesthetically pleasing than they were before.Not only that: to simplify charts customization and integration process, AnyChart supports Theming feature. Theming allows you to set similar visual and functional settings for all charts without the need to duplicate code. You can store themes in a separate file, reuse them and switch when needed.
- Check out Theming in the Documentation.
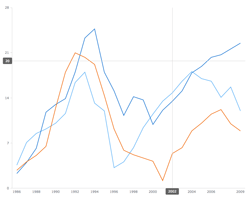
Chart Crosshair
Crosshairs are thin vertical and horizontal lines centered on a data point with the optional corresponding axis labels at the end of the lines. Crosshair is useful then you need locate with precision a particular point on the chart or to analyzing data when you need to compare different graphs.- Take a look at Chart Crosshair Sample in the Gallery.
- Check out Crosshair in the Documentation.
3D Pie/Donut Chart
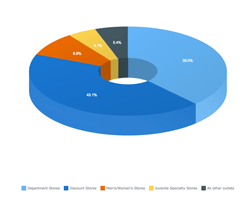
Information from simple Pies is very easy to read, and you can make look attractive and lively by turning them into 3D! Turn a flat Pie Chart into a 3D with .pie3d() method.- Take a look at Pie/Donut Charts in the Gallery.
- Check out Pie Chart in the Documentation.
Improvements::
Bug fixes:
- DVF-1471 Solved problem with Box Chart outliers on resize.
AnyChart version 7.5.1
Released Jul 8, 2015Improvements:
- DVF-1434 Animations behaviour improved.
Bug fixes:
- DVF-1536 Fixed the bug with multiple markers in Circular Gauges.
- DVF-1541 Solved issues with Minimim/Maximum Bubble size in Cartesian and Scatter Charts.
- DVF-1569 Fixed the Pie Inside Labels wrong overlapping.
AnyChart version 7.5.0
Released Jun 17, 2015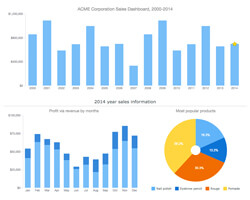
Dashboarding Tools
The purpose of the features named Dashboarding Tools is to provide simple and convenient instruments for building complex Dashboards. In this release we present the first part of this set: ability to highlight/hide series and points using special methods.- Check out Dashboarding Tools in the Documentation.
Printing
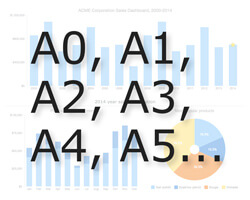
Printing method allows you to make a full-page print of a Chart or a Dashboard. It supports eight paper size formats: US Letter, A0 — A6 and the portrait/landscape switch.- Check out Printing in the Documentation.
Animation
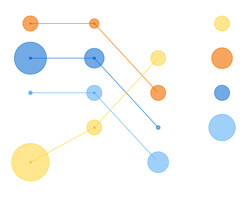
Animation for the most popular charts types: Line, Column, Bar, Area and so on. It supports duration settings and animation start and finish events.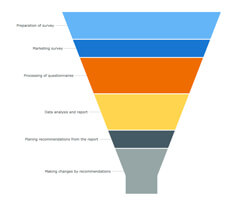
Funnel Charts
Funnel charts are so-called accumulation charts and they show percentage ratio. Funnel charts are often used to represent stages in a sales process and show the amount of potential revenue for each stage.- Check out Funnel Chart in the Documentation.
- Take a look at Funnel Chart in the Gallery.
Pyramid Charts
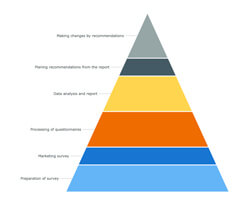
Pyramid charts are useful to visualize the hierarchical structure of topics, progressively ordered quantitative data.- Check out Pyramid Chart in the Documentation.
- Take a look at Pyramid Chart in the Gallery.
AnyChart version 7.4.1
Released May 15, 2015Legend api improved:
- Removed the itemsProvider method.
- Added the itemsSourceMode method, allowing a set of legend items to switch between series and categories.
- Added the items method, allowing to create a custom set of legend items.
- Added the itemsFormatter method, allowing to customize the default set of legend items.
- Added the itemsTextFormatter method, allowing to customize the text of legend items.
- Added the hoverCursor method, allowing to customize the behavior of the cursor.
- Added the inverted method, allowing to invert the sequence of legend items.
- Added the legendItem method for all series, allowing to customize legend items presented by series:
- highlights the series when a legend item is hovered,
- disables the series when a legend item is clicked.
- Added an easy way to customize the default behaviour via the preventDefault and stopPropagation methods.
Legend interactivity behaviour improved:
- Highlights series when legend item hovered.
- Disables series when legend item clicked.
- Added easy way to customize default behaviour via preventDefault and stopPropagation methods.
New features:
- DVF-402 Each AnyChart element (Title, Label, Legend, Point, etc.) now dispatches mouse events. See Base API Reference for more details.
- DVF-1326 Rewritten anychart.bubble and anychart.marker methods: now they create Scatter Charts instead of Cartesian.
- DVF-1335 Added ability to set maximum/minimum size for charts and other elements via maxWidth/maxHeight and minWidth/minHeight methods.
- DVF-1335 Fully rewritten anychart.ui.Table API.
- DVF-1328 Pie Charts now work with CSV data.
Other improvements:
- DVF-1168 The default interactivity now works the same in all chart types (Radar/Polar, Cartesian, Scatter, etc.).
- DVF-1349 Circular Gauges: drawing logic improved.
- DVF-1429 Credits now use HTTPS if possible.
Bug fixes:
- DVF-1180 Solved problems with multiple lines in texts (\n\n).
- DVF-1185 Tables are now redrawn when internal settings of charts are changed.
- DVF-1316 Y-scale is no longer inverted in Win/Loss series.
- DVF-1329 Changing the orientation of a Bullet Chart no longer causes the drawing bug.
- DVF-1331 Solved problems with drawing multiple axes in Cartesian and Scatter Charts.
- DVF-1325 Fixed the bug with Tooltips padding.
- DVF-1340 Hover settings for Data Labels now can be set from Data.
- DVF-1398 Fixed the bug with drawing Grids in IE6-8 (VML).
- DVF-1400 Fixed the bug with the Tooltips position in IE6-8 (VML).
AnyChart version 7.4.0
Released Mar 30, 2015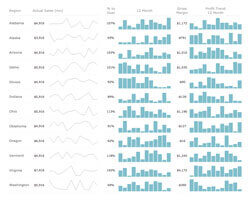
Sparkline Chart
Sparkline charts are designed to fit a lot of them in a tiny space. Sparklines are good at presenting changes in time for an array of similar data, e.g. currency or medical trends.- Check out Sparkline in the Documentation.
- Take a look at Sparkline Chart in the Gallery.
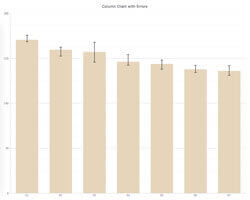
Error Chart
Error Charts are to be used as error or deviation indicators. Error bars often represent one standard deviation of uncertainty, one standard error, or a certain confidence interval.- Check out Error Chart in the Documentation.
- Take a look at Error Chart in the Gallery.
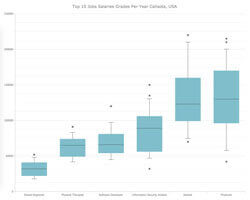
Box and Whisker Chart
Box Charts are predominantly used in descriptive statistics. Using a box chart is a way of representing groups of numerical data. Boxes operate with specific terms, such as whiskers, quartiles, and median.- Check out Box Chart in the Documentation.
- Take a look at Box and Whisker Chart in the Gallery.
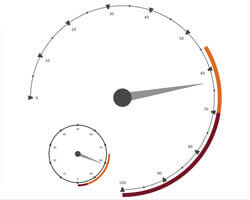
Circular Chart
Circular Gauge is a radial chart that can be used as a clock, speedometer, compass, audio feature tuner or any other gauge that represents the value as an angle on a circle plot.- Check out Circular Gauges in the Documentation.
- Take a look at Circular Chart in the Gallery.
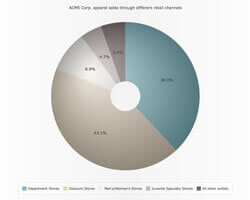
Pie/Donut Aqua Style
Aqua Style for Pie/Donut charts is a renewed gradient fill style which has become very popular among our users since AnyChart 5.0.- Take a look at Pie/Donut Aqua Style in the Gallery.
Improvements:
- DVF-1332 Soft Minimum/Maximum feature for Linear, Log and DateTime Scales.
- DVF-1208 Text Formatters functions reworked, performance improved.
Bug fixes:
- DVF-1210 Problems with drawing legend separators.
- DVF-1167 Multiple line-breaks (\n\n) in all texts bugfix.
- DVF-1251 toJson() serialization bugfix.
- DVF-1227 Bullet Chart data streaming bugfix.
- DVF-1287 Problems with string data in DataSet.
- DVF-1232 The hAlign and vAlign values are normalized properly now.
- DVF-1275 Problems with disabling series tooltip bugfix.
AnyChart version 7.3.1
Released Jan 21, 2015Bug fixes:
- DVF-1211 Problems with updating data points on Pie Charts.
- DVF-1215 Problems with updating legend items and appending series in Scatter/Cartesian/Radar/Polar Charts.
AnyChart version 7.3.0
Released Dec 15, 2014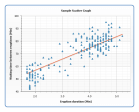
Scatter Chart
Scatter charts show the relationships among the numeric values in several data series, or plots two groups of numbers as one series of XY coordinates.- Check out Scatter Chart in the Documentation.
- Take a look at Scatter Chart in the Gallery.
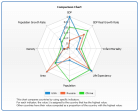
Radar Chart
A Radar chart is a graphical method of displaying multivariate data in the form of a two-dimensional chart of three or more quantitative variables represented on axes starting from the same point.- Check out Radar Chart in the Documentation.
- Take a look at Radar Chart in the Gallery.
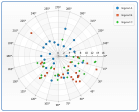
Polar Chart
Polar chart plot allows to draw scatter chart using polar coordinate system, which is is a two-dimensional coordinate system in which each point on a plane is determined by a distance from a fixed point and an angle from a fixed direction.- Check out Polar Chart in the Documentation.
- Take a look at Polar Chart in the Gallery.
Improvements:
- DVF-767 SVG Export Option.
- DVF-1187 Pie with one point display.
- DVF-1166 Charts with no data doesn't generate an error now.
Bug fixes:
- DVF-1170 textMarker anchors problem.
- DVF-1167 Pallette problems.
- DVF-1162 Long labels wrapping issue.
- DVF-1160 Pie outside labels bugfix.
- DVF-1135 Rendering problems in IE11 fixed.
- DVF-1134 Chart resize bugfix.
- DVF-1113 Legend series marker in legend problem.
- DVF-1100 Outside pie labels in a single-point.
- DVF-1086 Min/max settings in Bubble chart.
- DVF-1061 negativeHatchFill in Bubble series problem.
- DVF-1056 Container resize problem with JQuery UI.
- DVF-1043 .dispose() method issues.
- DVF-988 Hidden containers problem.
AnyChart version 7.2.0
Released Oct 23, 2014New features:
- DVF-532 Table Layout.
- DVF-815 Add/Remove/Update Operations.
- DVF-823 Bullet Chart Type.
Improvements:
- DVF-772 Performance improvements.
- DVF-933 Framework Warnings and Errors Improvement.
Bug fixes:
- DVF-944 Z-index bugfix.
- DVF-946 Marker issues in DateTime scales.
- DVF-983 FireFox 32 and IE11 chart bugfix.
AnyChart version 7.1.1
Released Sep 18, 2014Bug fixes:
- DVF-752 SVG namespace was duplicated declaration in IE.
- DVF-808 AnyChart conflicted with prototypejs library.
- DVF-927 After using the chart.draw() method, the values for the text, line, and range markers were not recalculated.
- DVF-926 The legend height was sometimes calculated incorrectly.
- DVF-919 Rendering problems in IE8.
- DVF-918 The grid was always drawn over the chart series.
- DVF-917 After turning off series, markers were not turned off.
- DVF-916 The marker stroke did not get the series settings.
- DVF-915 Series label setter did not work.
- DVF-912 There were problems with the X-axis DateTime scale.
- DVF-899 There were a problem with the markers in the legend icon.
- DVF-897 TextMarker was positioned incorrectly.
- DVF-896 Area overlapped other series.
- DVF-895 The xAxis(index, value) and yAxis(index, value) methods did not work.
- DVF-842 The OHLC series had an incorrect color if data were set using CSV.
- DVF-764 After the draw() event, changes were not applied to the axis title.
- DVF-762 Label settings override did not work in the Pie Chart data.
- DVF-754 There were bugs with the hatch fill in cartesian series.
AnyChart version 7.1.0
Released Aug 29, 2014New features:
- Pie Chart labels outside position support
- Axes labels stagger position support
- Legend items icon customization
- Legend tooltip feature
- Axes labels stagger position support
Improvements:
- Series formatting improvement
Bug fixes:
- DVF-808 AnyChart does not work correctly with prototypejs.
AnyChart version 7.0.0
Released Jul 3, 2014New generation of AnyChart products:
- Consistent and Flexible JavaScript API.
- New Built-in Graphics engine.
- XML, JSON, CSV Data formats support.
- Dashboard oriented data model.
- Significant performance improvements.
- All charting elements can be used as standalone features (labels, titles legend, axes, etc).
- IE6+ Support.