AnyChart is a lightweight and robust JavaScript charting library with great API, documentation, and enterprise-grade support.
It's been developed since 2003 with one main idea - it should be easy for any developer to integrate beautiful charts into any mobile, desktop or web product. As a result, AnyChart today is a data visualization layer for thousands of great products. Our clients include both Fortune 500 companies and startups.
Our component works with any database and runs on any platform. The source code is open - you can download and edit it, it gives a great flexibility. Accessibility feature is a very important for us - we completely support Section 508 requirements. Thousands of out-of-the-box code samples in our playground, plugins and integrations, ready-to-use business solutions allow implementing industry-standard visualizations in minutes.
Developed for developers! Learn more about some AnyChart features here: chart types, customization, exporting and sharing, dashboarding, localizations.
Current and Future Leaders trust us
More than 75% of the Fortune 500 companies and thousands of startups are happy with AnyChartWide variety of JavaScript Chart types
AnyChart allows you to display 69 charts out-of-the-box chart types and provides features to create your own types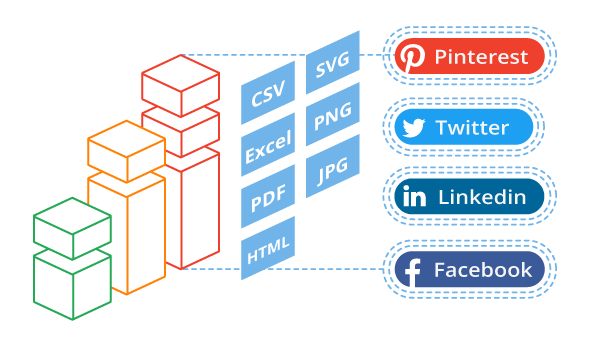
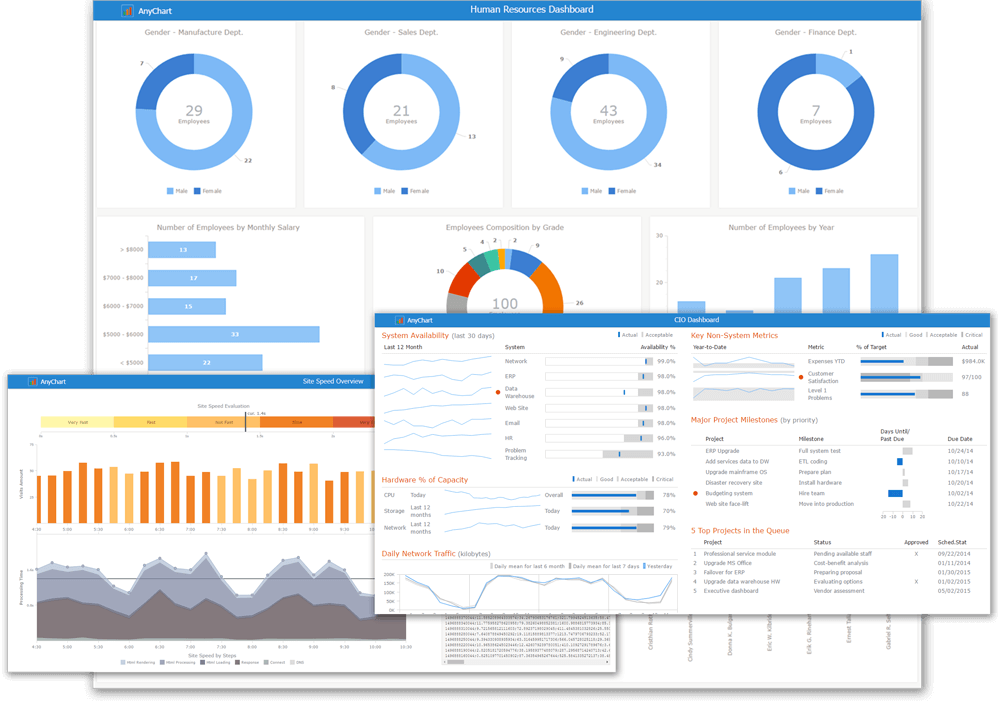
Business intelligence dashboards arrange numbers, metrics and performance scorecards on a single screen. Dashboards help executives, management, and employees to view KPI's and assess the situation. BI dashboards help to understand the data and improve the efficiency of an organization.
AnyChart provides many sample web-applications with interactive BI dashboards. Every interactive JavaScript dashboard in these apps is created with AnyChart.
Thousands of companies already use AnyChart to create interactive dashboards. Join us and build your own!
Are you building Sales Dashboard, Site Speed Monitor, CIO Dashboard, Investment Portfolio, Human Resources Dashboard, Technical Support Dashboard? AnyChart can do this and more.
Contact Our Sales Representatives
Our Sales Representatives will be happy to talk to you and answer any questions regarding our products, licensing, purchasing, and everything else.- +1 (279) 499-2767 (USA)
- +44 (800) 0584677 (Europe)
- sales@anychart.com