We use cookies to ensure that we give you the best experience on our website. If you continue to use this site we will assume that you are happy with it. Read more about our Privacy Policy and Cookie Policy
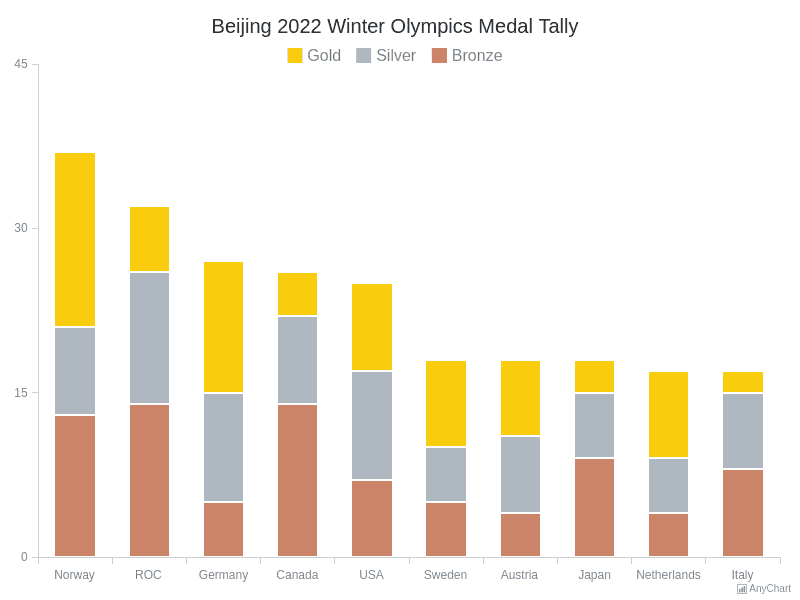
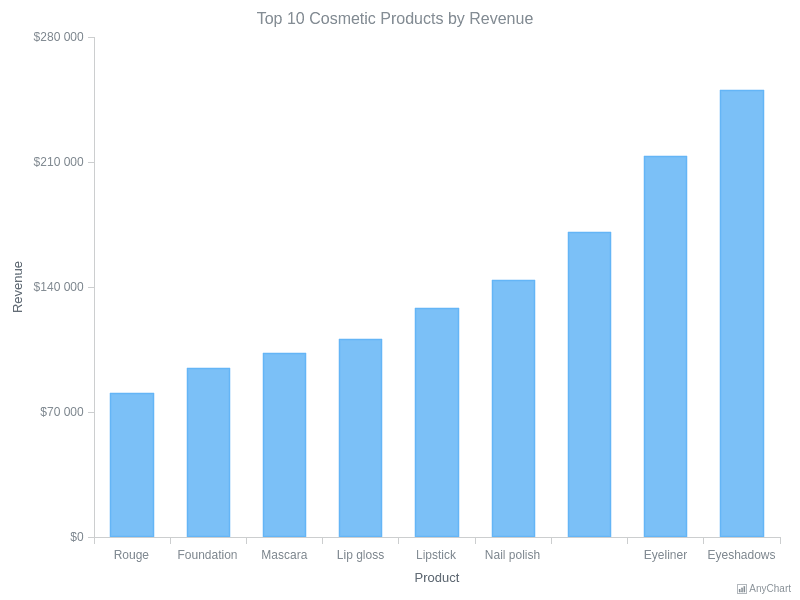
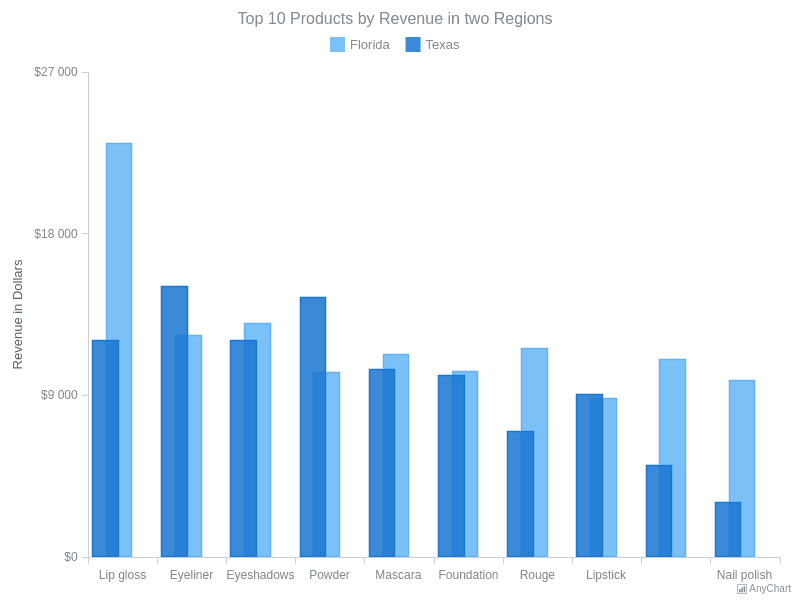
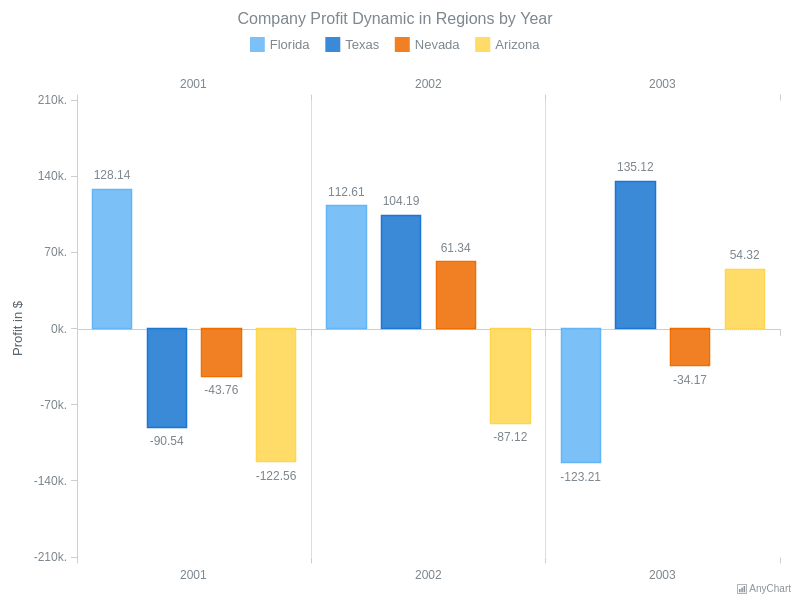
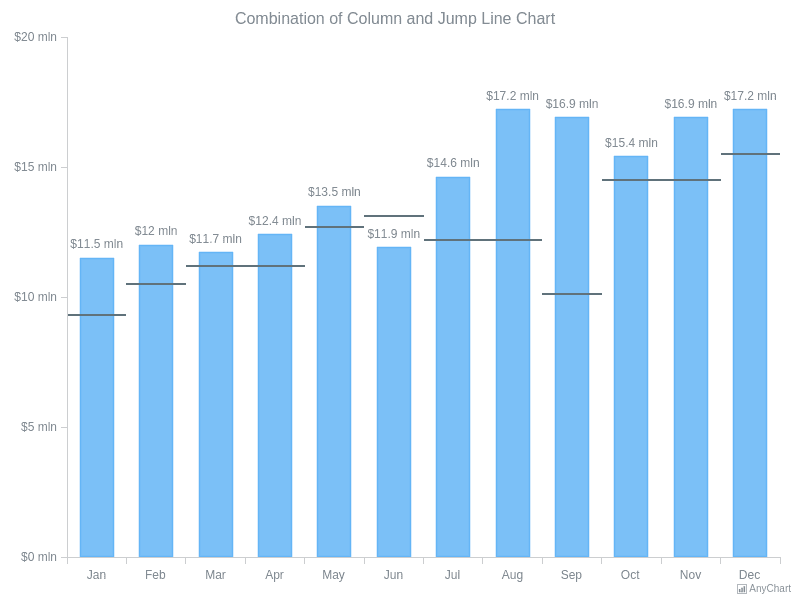
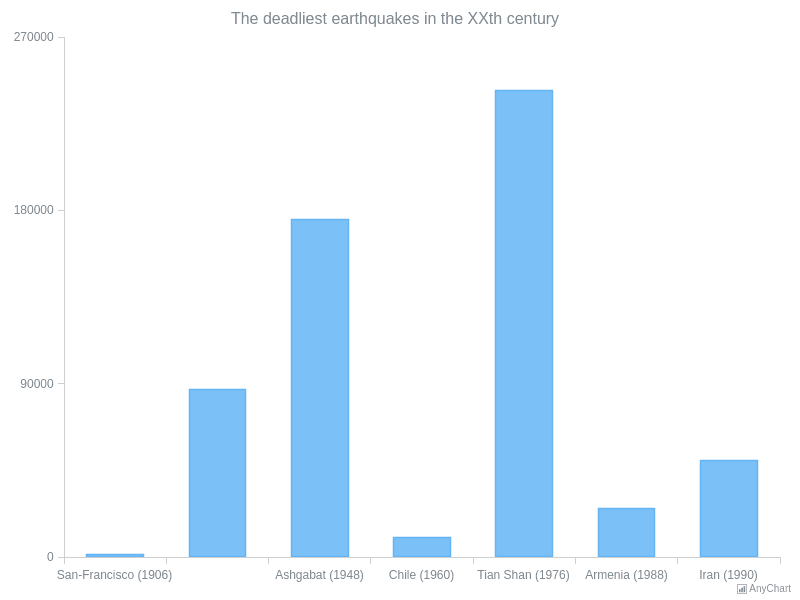
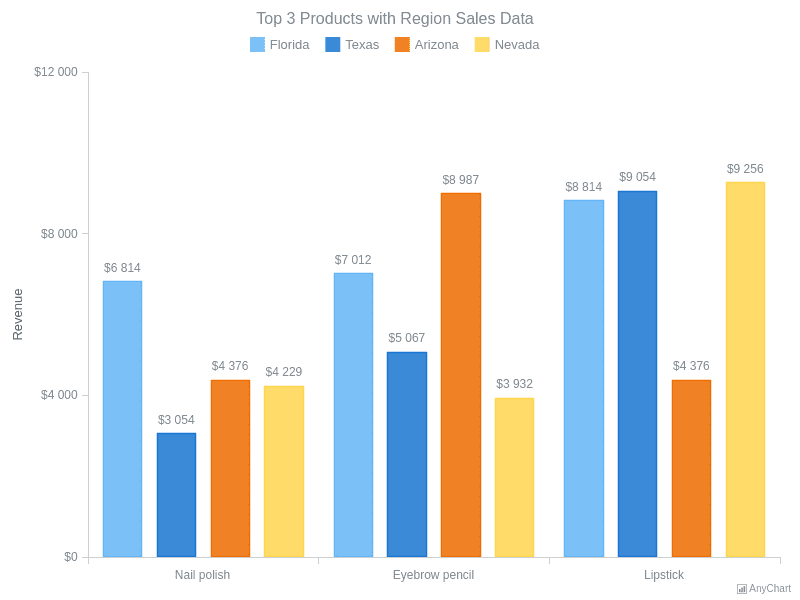
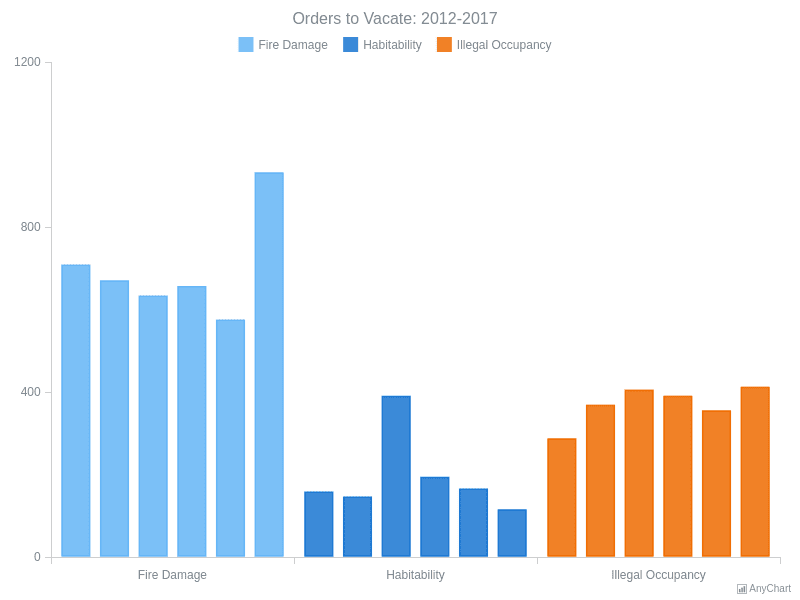
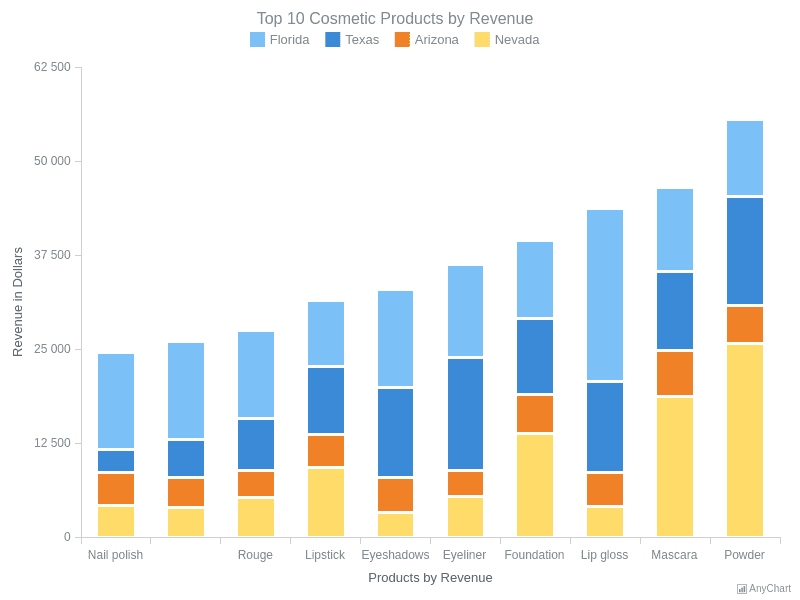
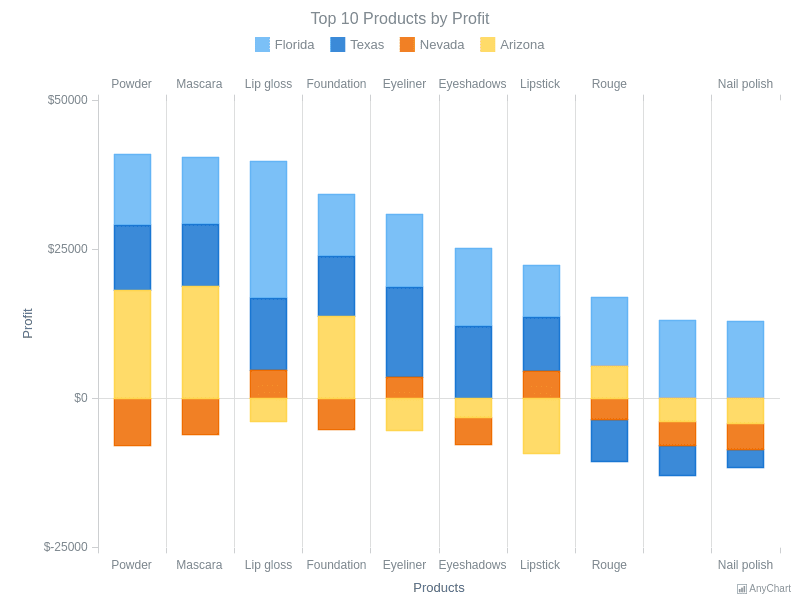
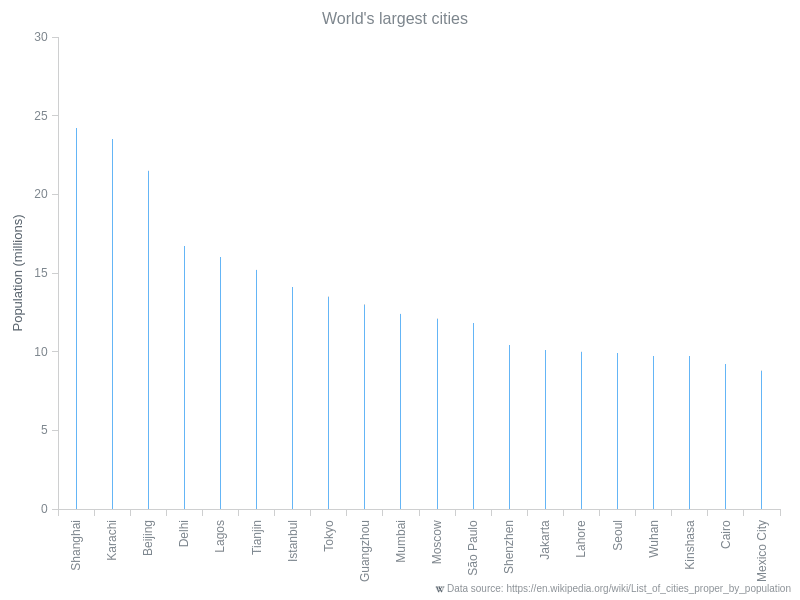
Column charts use vertical bars to compare values across categories or time periods. Explore single-series, multi-series, stacked, percent-stacked, stick, jump-line combinations, and categorized-by-series modes.