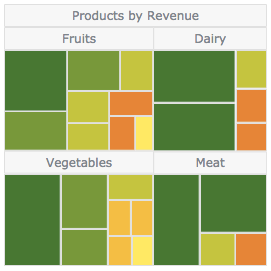
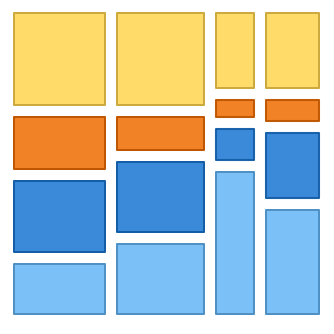
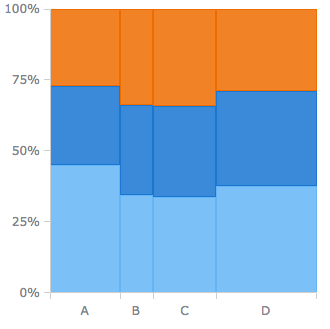
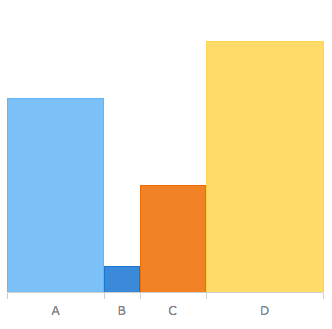
Proportion
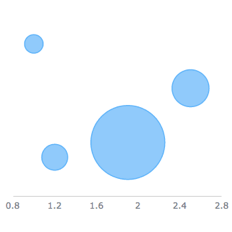
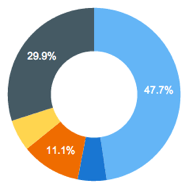
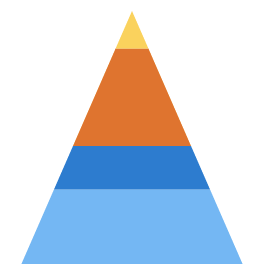
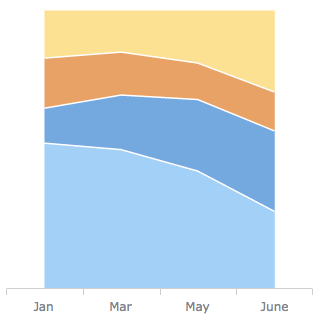
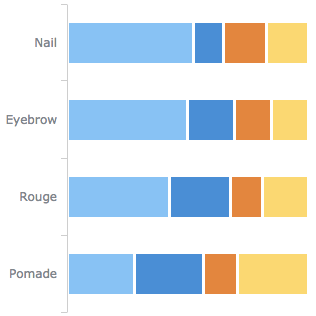
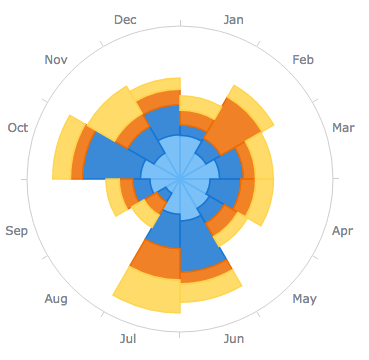
The present section lists the types of chart that visually bring data proportions into focus.
These are helpful for roughly estimating the difference between values at a glance.
As a result, the following chart types make it easy to identify approximately equal as well as obviously different values.
Learn more about each of them to see which one should work best with your data and current purpose of analysis.