The very first version of AnyChart hit the shelves more than 10 years ago, check out what our products went through and see what's new in the most recent update.
Version 8.x History
AnyGantt version 8.14.0
Released Nov 19, 2025DVF-4708 — Drag periods between rows
Added the ability to drag periods between rows in Gantt charts. See the Live Edit examples in our documentation and the beforeUpdatePeriod event in the API reference for details.
Improvements:
DVF-4709 — API support for selecting periods
Added API support for selecting periods. You can now use the selectTimelineRow() method described in our API reference.
Licensing update
We updated the licensing system. If you have any questions about your license, please reach out to our team.
AnyGantt version 8.13.1
Released Jun 17, 2025DVF-4701 — Enhanced Row Coloring
The coloring of Gantt chart rows has become more flexible: you can now use functions to set both the row fill and the row stroke. This allows dynamic control over how each row and its separating line are styled.
- Take a look at rowFill() and rowStroke() in the API.
DVF-4702 — Connector Caps Control
We've added the option to disable arrow caps on connectors that indicate task dependencies. These arrows were always shown before, but can now be hidden to display connectors as plain lines.
- Take a look at allowConnectorCaps() in the API.
DVF-4705 — Gantt Weeks Configuration
From this release on, you can make the first day of the year always start a new week, and also configure each month to begin with a new week as well. Both of these behaviors are now supported via new dedicated methods.
- Take a look at weeksCycleMonthly() and weeksEndWithYear() in the API.
Improvements:
- DVF-4704 — Added support for baselines in the Resource Gantt Chart via baselineStart and baselineEnd fields in the period data.
Bug fixes:
- DVF-4706 — Fixed rowMouseUp event firing twice, ensuring correct script behavior.
AnyGantt version 8.13.0
Released Sep 24, 2024Improvements:
- Minor improvements and chart updates.
AnyGantt version 8.12.0
Released Dec 4, 2023Bug fixes:
- DVF-4652 — Milestones preview on grouping tasks issue fixed
- DVF-4648 — onEditStart function context issue fixed
- DVF-4582 — Tooltip issue on loadable grouping task fixed
AnyGantt version 8.11.1
Released May 10, 2023Bug fixes:
- DVF-4667 — Resource labels crop/overlap issue fixed
AnyGantt version 8.11.0
Released Dec 7, 2021
DVF-4638 — Baseline milestones
Now you can put milestones on both Actual and Baseline elements making your project tracking with AnyGantt even more flexible than it was.
- Take a look at Timeline.baselineMilestones() in the API.
- Take a look at Updated Planned vs. Actual Chart sample in the Gallery.
Bug fixes:
- DVF-4635 — Datagrid labels issue fixed
AnyGantt version 8.10.0
Released May 20, 2021Improvements:
- DVF-4561 — Preview milestones show only when collapsed option
Bug fixes:
- DVF-4606 — Tooltip issue fixed
AnyGantt version 8.9.0
Released Sep 29, 2020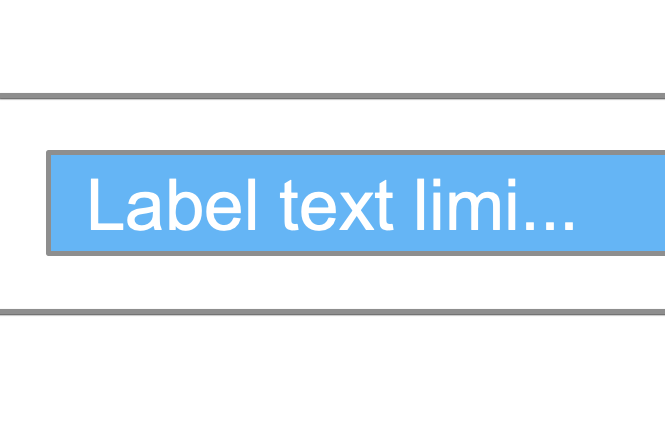
DVF-4373 — Labels text length
Added an option to limit the number of characters in labels for easier control over the chart display.- Take a look at maxLength() in the API.

DVF-4383 — Client-side CSV/XLSX export
CSV/XLSX can now be exported on client-side, without the help of an export server.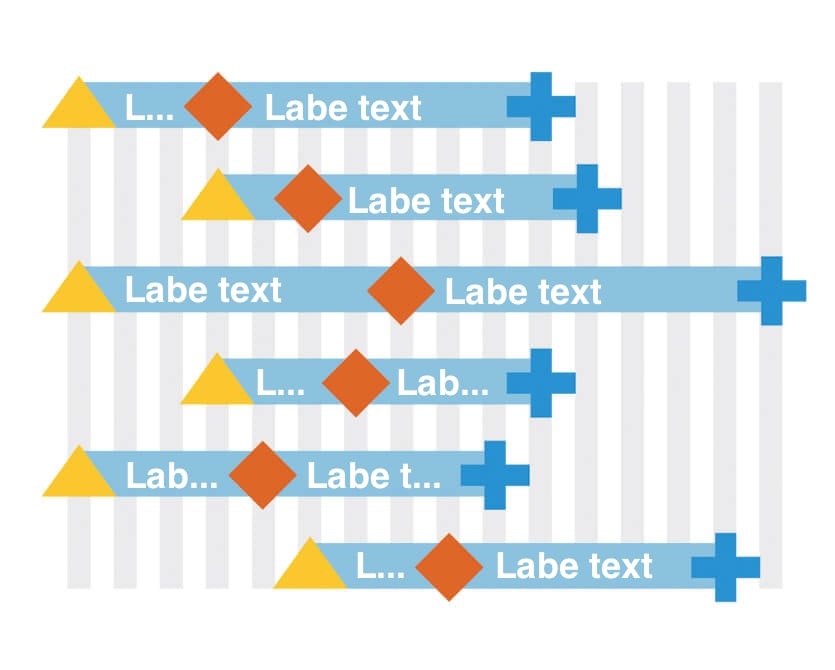
DVF-4359 — Labels overlap
New option to hide labels when they overlap.- Take a look at cropLabels() in the API.
Improvements:
- DVF-4444 — Pixel gaps support added
- DVF-4460 — Visible range printing added
- DVF-4470 — Item info now provided in the context menu
Bug fixes:
- DVF-4429, DVF-4430 — Client-side exports issues fixed
- DVF-4469 — Resource period offset and height can now be set from the data
- DVF-4477 — Resource tooltip issue fixed
- DVF-4434 — Labels issue fixed
API changes:
View deprecates table
AnyGantt version 8.8.0
Released May 22, 2020
DVF-4370 — Weekends, Holidays and Nonworking Time Coloring
Project and Resource Gantt Charts now have an option to color holidays, weekends, and nonworking time.Use anychart.core.ui.Timeline#weekendsFill, anychart.core.ui.Timeline#holidaysFill and anychart.core.ui.Timeline#workingFill methods you can set how weekends, holidays and nonworking time defined by anychart.core.gantt.Calendar#holidays and anychart.core.gantt.Calendar#schedule methods.
- Take a look at Milestones Preview Marker Type in the Gallery.

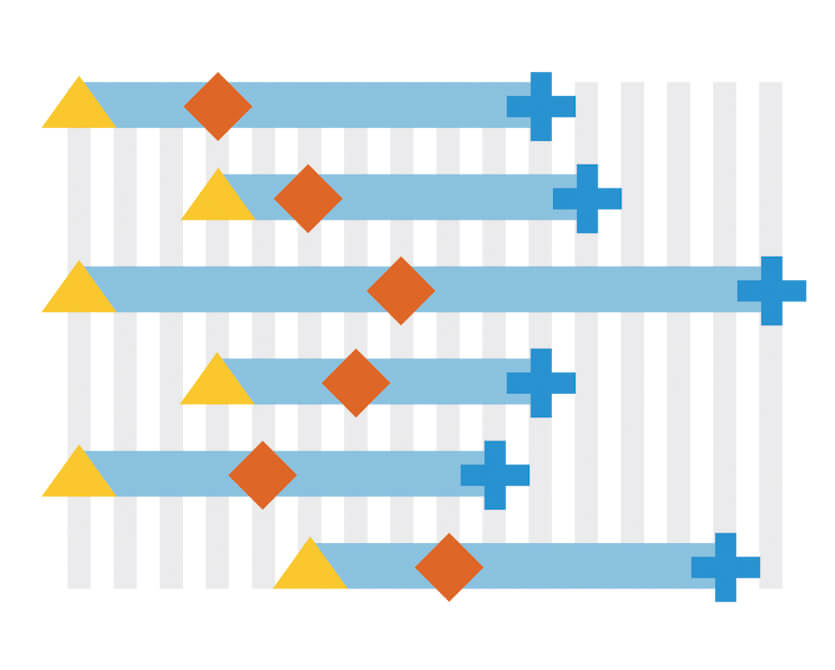
DVF-4397 — Start/End Markers
Project Gantt Chart got an option to show start/end markers for actual, baseline, and progress bars with the startMarker() and endMarker() methods.- Take a look at Start/End Markers in the Gallery.
DVF-4405 — Milestones on Resource chart
You can now display Milestones on the Resource Gantt Chart, this provides you with an option to show multiple milestones with individual tooltips in one line.- Take a look at Milestones on Resource Chart in the Gallery.
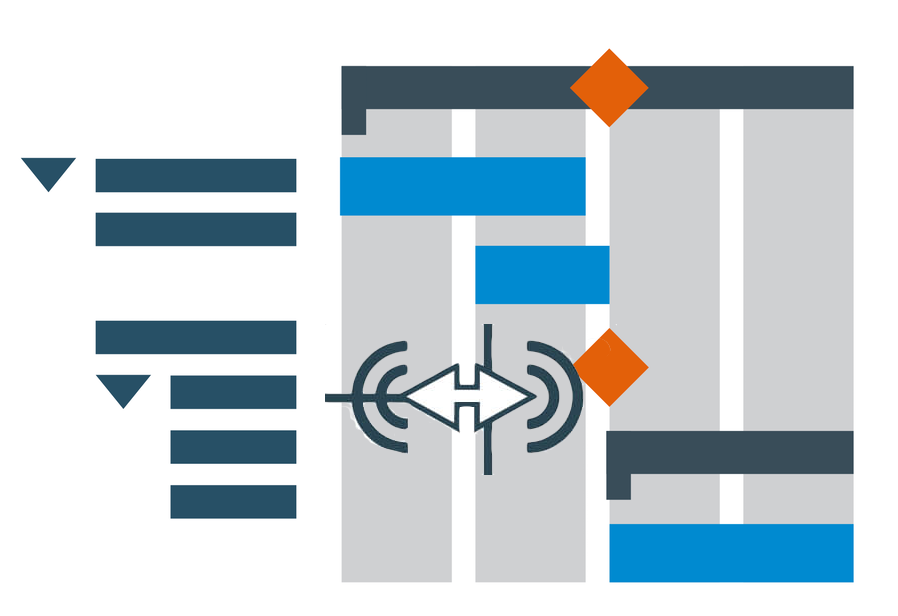
DVF-4376 — Zoom onMouseWheel
Change how the chart behaves when the mouse wheel is used: zoom or scroll. Use the zoomOnMouseWheel() to change it.- Take a look at Start/End Markers in the Gallery.

DVF-4386 — Text shadow effect
Most of the text elements got an option to tune text shadow with the textShadow() method.Shadow effect can help with text display on certain background colors or give your visualizations more wow-effect.
- Take a look at Gantt Resource Chart with Adaptive Labels Format in the Gallery.

DVF-4399 — Fiscal Year Shift
Now you can set the start of the fiscal year to any of the months in this or next year. This allows you to display a timeline properly in the world of financial or budget years.Improvements:
- DVF-4404 — Grouping tasks no longer incorrectly get settings from the task section. Note: this may change how your charts look if you relied on this setting, please test if you are upgrading.
Bug fixes:
- DVF-4358 — LliveEdit Issues fixed
- DVF-4378 — Milestone progress issues fixed
- DVF-4388 — Padding settings issues fixed
- DVF-4389 — Grouping Task disabling issue fixed
- DVF-4401, DVF-4414 — Datagrid disabling issues fixed
AnyGantt version 8.7.1
Released Dec 17, 2019Bug fixes:
- DVF-4315, DVF-4325 — Client-side export issue
- DVF-4319 — Hover cursor on legend
- DVF-4341 — Selection Marquee issue
- DVF-4226 — ResourceChart weekend range issue
- DVF-4316 — Timeline chart range series issue
- DVF-4324 — Progress value label issue
- DVF-4357 — Ticks count issue
- DVF-4360 — Datagrid issue
Improvements:
- DVF-4320 — Disable credits over theme
- DVF-4336 — toolbar expand/collapse icons change
- DVF-4356 — milestone preview own tooltip
AnyGantt version 8.7.0
Released Aug 7, 2019
DVF-4247 — Client-Side Export
We've added the client-side export feature to all our JavaScript charting libraries - AnyChart, AnyStock, AnyGantt, and AnyMap. This will allow you to have your data visualizations saved as images (SVG, PNG, and JPG) and PDF documents without a roundtrip to the server, by leveraging the built-in browser features for a seamless JS chart export, fast and secure.
DVF-4235 — Milestone Preview on Parent Task Bar
Milestone preview on the parent task bar is now available in the AnyGantt library. This new feature will allow the viewer of a Gantt chart to quickly understand what milestones such a task has and then expand it to learn the details if needed.- Take a look at Milestone Preview on Parent Task Bar in the Gallery.

DVF-4269 — Custom Marker for Milestone
In release 8.7.0, we've also added an option to customize milestone markers on Gantt charts by type and color. So now you can easily differentiate between the milestones of non-identical nature within the same project by depicting them in different ways.- Take a look at Custom Marker for Milestone in the Gallery.

DVF-4270 — Custom Basic Year
Previously, our Gantt charts only supported the calendar year as the basic year period. Now, it is possible to define a custom one. For example, you can go ahead and set a fiscal (financial) year, or an academic year, or any other year depending on what point of reference you actually need in this regard; quarters will be formed accordingly.- Take a look at Custom Basic Year in the Gallery.
Improvements:
- DVF-4277 — Legend. Add some icons support
- DVF-4244 — All elements has own tooltip settings
- DVF-4236 — Tooltbar improvements
Bug fixes:
- DVF-4201 — Legend issues
AnyGantt version 8.6.0
Released May 15, 2019Improvements:
- Improved Gantt Documentation
- DVF-3596 — AnyChart Locales Improved
- DVF-3597 — Custom Messages in locales
- DVF-4018 — Timeline header performance improved.
- DVF-4016 — Datagrid performance improved.
- DVF-4073 — Auto localized context menu from the included locale
Bug fixes:
- DVF-4210 — Editing issues fixed.
- DVF-4215 — Row deselection issue fixed.
- DVF-3944 — Resize event issues fixed.
- DVF-4187 — Charts disposing improved.
AnyGantt version 8.5.1
Released Feb 4, 2019Bug fixes:
- DVF-3618 — fixed issue with tooltip on live edit
- DVF-4040 — fixed rowMouseOver event firing after rowClick event
- DVF-4087 — fixed performance issue with gantt markers
AnyGantt version 8.5.0
Released Dec 24, 2018New features:
- DVF-4015 Datagrid Text Improvements: Working with texts in Datagrid has been significantly improved to boost the performance.
Improvements:
- DVF-3323 — scrollTo for Gantt charts improvement: The scrollTo method now works both as getter and setter. The returned value is in pixels.
Bug fixes:
- DVF-3957 — Gantt header locale problem fixed.
- DVF-3958 — Datagrid in SVG fixed for proper support of Internet Explorer.
- DVF-3974 — Empty Gantt serialization issue fixed.
AnyGantt version 8.4.2
Released Nov 23, 2018Improvements:
- DVF-3323 — ScrollTo() Improvement
Bug fixes:
- DVF-3957 — Timeline's header labels format issue
AnyGantt version 8.4.1
Released Oct 30, 2018Bug fixes:
- DVF-3958 — Datagrid in SVG fixed for proper support of Internet Explorer.
- DVF-3974 — Gantt serialization issues fixed.
AnyGantt version 8.4.0
Released Oct 5, 2018
DVF-3857 — Performance issues
We have significantly improved the performance.Bug fixes:
- DVF-3899 — Now the data grid is rendered correctly when resized with the splitter.
- DVF-3835 — Fixed the issue with tree search.
- DVF-3807 — Tokens now work correctly when used to format the timeline header.
- DVF-2473 — Fixed the PERT CRUD issue.
AnyGantt version 8.3.0
Released Jul 10, 2018
HTML Tooltips Support
Tooltip customization is way easier now. Full support of HTML is available. You can write your own HTML code and customize tooltip visualization using CSS classes.- Take a look at HTML Tooltip in the Gallery.
- Check out HTML Tooltip in the Documentation.

Gantt Editing API Improvements
Gantt charts editing API is thoroughly revised and improved.- Take a look at Gantt Editing API Improvements in the Gallery.
- Take a look at Gantt Editing API Improvements in the API.
Improvements:
- Color palettes improvements
- Gantt Datagrid buttons UI customizations
Bug fixes:
- Color functions anychart.color.darken and anychart.color.lighten issues
- XML serialize scale ticks issue
- Escape/Unescape symbols in XML serialization
- LiveEdit context issue
- resourceList issues
AnyGantt version 8.2.1
Released Apr 16, 2018New features::
- DVF-3656 — The filter() method added.
Bug fixes::
- DVF-3673 — Formatting fuctions context issues fixed.
AnyGantt version 8.2.0
Released Mar 26, 2017
Data Grid Live Editor
Grid cells of the Gantt Chart can now be edited in the Live Edit mode. If the input data is valid, all the changes can be saved or aborted if otherwise.
Brand New Timeline
Release 8.2.0 has brought significant improvements to the timeline header in Gantt charts. From now on, the number of its levels and their format can be set manually, which further increases the timeline's flexibility. In addition, automatic formatting of dates in response to zoomIn and zoomOut has become even better.
Custom Drawing
We've made it possible to override drawing of any Gantt timeline element (baseline, milestone, etc.). There are no limits to how they can look, you can create any custom visualization based on your imagination.Improvement:
- New Gantt API for Timeline elements
- Data Grid Expand/Collapse buttons customization
API changes:
AnyGantt version 8.1.0
Released Dec 20, 2017
Conditional Coloring
Now it's possible to apply colors to the elements of Gantt charts using functions. Each of the functions contains a comprehensive set of data about an element to be colored. Below is the list of methods now supporting such functions: rowHoverFill(), rowSelectedFill(), connectorFill(), connectorStroke(), selectedConnectorStroke(), baseFill(), baseStroke(), baselineFill(), baselineStroke(), milestoneFill(), milestoneStroke(), parentFill(), parentStroke(), progressFill(), progressStroke(), selectedElementFill(), selectedElementStroke().- Take a look at Gantt Chart with Conditional Coloring in the Gallery.
- Check out Gantt Chart Coloring in the Documentation.

Element Size and Position settings
To improve the visual perception of Gantt Charts and make it easier to customize them according to a style, we've added a lot of settings for adjusting the size and the position of all elements in a Gantt Chart. Here's the complete list of such methods: baseBarHeight(), baseBarAnchor(), baseBarPosition(), baseBarOffset(), baselineBarHeight(), baselineBarAnchor(), baselineBarPosition(), baselineBarOffset(), parentBarHeight(), parentBarAnchor(), parentBarPosition(), parentBarOffset(), progressBarHeight(), progressBarAnchor(), progressBarPosition(), progressBarOffset(), milestoneHeight(), milestoneAnchor(), milestonePosition(), milestoneOffset().- Take a look at Gantt Chart with Elements Custom Size and Position in the Gallery.

Adaptive Text Formatting
Now you can adjust the format of Gantt Timeline labels manually using the new measureWithText() method.- Take a look at Gantt Resource Chart with Adaptive Labels Format in the Gallery.
- Check out Gantt Chart Labels in the Documentation.
Improvement:
- Now all colors used by the elements of a Gantt Chart can be set via the palette() method.
- Improved the default settings of Timeline Tooltips, now they can freely leave chart area.
- Improved memory allocation when running AnyChart in Node.js environment.
- Added new Gantt Chart getRange(), getTotalRange() methods to get current values of date/time range settings.
- Added new autoRedraw method that significantly improves the rendering performance during CRUD operations.
- String Tokens now auto-detect the type of formatting (string, number or DateTime) by token arguments. In addition, formatting types can now be defined directly using the type argument.
Bug fixes:
- Fixed bug with DataGrid drag&drop.
- Fixed issues with extra small and extra large values formatting.
- Fixed issues with unicode symbols in String Tokens (desk case #3833, TS-415).
- Fixed bug with Indian locale (desk case #3283, TS-201).
- Fixed issues with inappropriate chart rendering into containers with flex layout in Firefox.
- Fixed scrolling issues in Firefox.
- Fixed context menu bug that appeared after clicking on collapse/expand buttons.
AnyGantt version 8.0.0
Released Oct 2, 2017
Modular System
Modular System is the core of AnyChart 8. It allows you to significantly reduce the size of the JavaScript running on your web page by connecting only those chart types and features that you actually use. The modular based AnyChart is perfectly compatible with popular bundling tools such as Webpack, Browserify, and so on. Use our JS Builder to easily generate a custom build.- Check out Modular System in the Documentation.

Custom JavaScript Builds
Custom JavaScript Builder is designed for assembling a JavaScript file that contains only the features and chart types you are really going to use. The AnyGantt version 8.0.0 contains 30 modules and 16 themes . You can also build a file that contains your license key .- Check out Modular System in the Documentation.

Node.js Server-side Rendering
Node.js server is a lightweight web server that provides API for generating vector graphics (PDF, SVG, or PS), bitmap images (PNG, JPG, or TIFF), PDF reports, and data in CSV and XLSX (Excel). It uses the JavaScript code as well as JSON and XML configurations as input data. The server is very easy to install and customize, you can run it on any major platform: Linux, Windows, and macOS. It is ideal for creating report systems that send charts via email or social network sharing tools.
No Data Label Feature
No Data Label Feature is an API designed to notify the chart viewer that data is not available. Data can be missing due to its absence by default or if it has been removed by means of the Data Updating API, Exclude Data Point feature, or through the interactivity.- Check out No Data Label in the Documentation.

CSV/Excel Export Reworked
By popular demand, we've remastered the algorithm for preparing CSV/Excel data for charts. Now it takes into account the chart type specific features and allows you to use multiple data sets for different series.- Check out Data Export in the Documentation.

Chart Export Settings
Now you can customize the export settings for each chart: links and descriptions for sharing on Facebook, image export options, and so on.- Take a look at Chart Export Settings in the API.
- Check out Chart Export Settings in the Documentation.
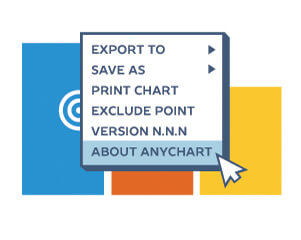
Context Menu Customization API
We've significantly simplified the process of the context menu customization. Now each item of the context menu is assigned with an ID that can be called to access the corresponding fields and settings as well as to add custom ones. We've also added the option to localize the context menu.- Check out Context Menu in the Documentation.
General API Improvements
We've substantially improved the AnyChart JS Charts API specifically for the 8th generation of our JavaScript charting libraries. Appearance settings, Grids settings , Data Mapping settings can now be made much easier. To facilitate and streamline the transition from AnyChart 7 to AnyChart 8, we've created the Migration Tool that will allow the majority of users to switch over to the new version in semi-automatic mode.- Check out Migration Process in the Documentation.

Timeline Labels Settings
Gantt Timeline text formatting properties are now flexible to the greatest possible extent. To achieve that, we've added the following methods: baseLabels(), baselineLabels(), parentLabels(), milestoneLabels(), progressLabels(). We've also remastered method labels() so it can be utilized to set the defaults for any type of label.- Take a look at Timeline Labels Settings in the Gallery.
- Check out Timeline Labels Settings in the Documentation.
Bug fixes:
- Fixed Data Grid Splitter bug (TS-215, TS-225)