The very first version of AnyChart hit the shelves more than 10 years ago, check out what our products went through and see what's new in the most recent update.
Version 7.x History
AnyGantt version 7.14.4
Released Nov 16, 2017Changes:
- Fixed rendering bugs in IE 6-8
- Rework CSV export
AnyGantt version 7.14.0
Released May 31, 2017AnyGantt version 7.13.1
Released April 11, 2017
Angular 2 plugin
We are happy to announce the release of the AngularJS v2.x directives for AnyChart.Typescript support:
Now you can use AnyChart in your TypeScript projects - we have definition file for our library which you can find in distribution folder.Bug fixes:
- TS-19 — Fixed issues with AnyChart Fonts.
AnyGantt version 7.13.0
Released February 28, 2017
AnyChart in Now Open
Reliability has always been our company's first priority. And you definitely know you can trust us, with our public roadmaps, consistent releases, and highly experienced Quality Assurance team. Today we are glad to tell you about another major step that we have just taken in this regard: AnyChart is now open! Basically, it means the following:- The Source code of our product is available for review and download on GitHub.
- The public issues tracker is open to all who are ready to help us further improve our product.
- Public Build scripts allow you to compile custom binaries with the chart types you need.
- The open branches list demonstrates our development cycle and proves you can trust us.


Sharing
Now any chart can be shared on social networks with the help of the context menu. Properties specific to a particular social network can be set in the exports namespace.- Check out Sharing Charts in the Documentation.

Resource Chart Interactivity
We are glad to announce that now, starting from the current release, the Hover and Select interactivity settings are also available in our new Resource charts.- Take a look at Resource Chart Interactivity in the Gallery.
Resource Chart Events
Events are now available in new Resource charts. They will allow you to easily integrate a chart of this type with external UI elements and add custom interactivity.
Resource Chart Tooltips
In this release, we have also added Tooltips to the new Resource chart. Now you can use this important feature to display additional information about each activity in a convenient, interactive way.- Take a look at Resource Chart Tooltips in the Gallery.

Connectors Customization features
Tuning the visual appearance of the Live Editing mode in Gantt charts is now more flexible with the new connector customization features.- Take a look at Connectors Customization features in the Gallery.
AnyGantt version 7.12.0
Released October 31, 2016
Brand New Resource Chart (Beta)
We are doing our best to improve our products and this time we decided to take a fresh look at Gantt and Resource charts. We have studied how people manage projects and company resources, what they want to see, how they want to display things happening, and goals they want to achieve. As the result, we understood that we have to redesign Resource and Gantt Charts completely. In this release we present the beta version of new Resource Chart.- Take a look at Resource Chart in the Gallery.
- Take a look at Resource Chart with Time Tracking in the Gallery.
- Check out Resource Chart in the Documentation.
- Check out Resource Chart with Time Tracking in the Documentation.

Calendar Support
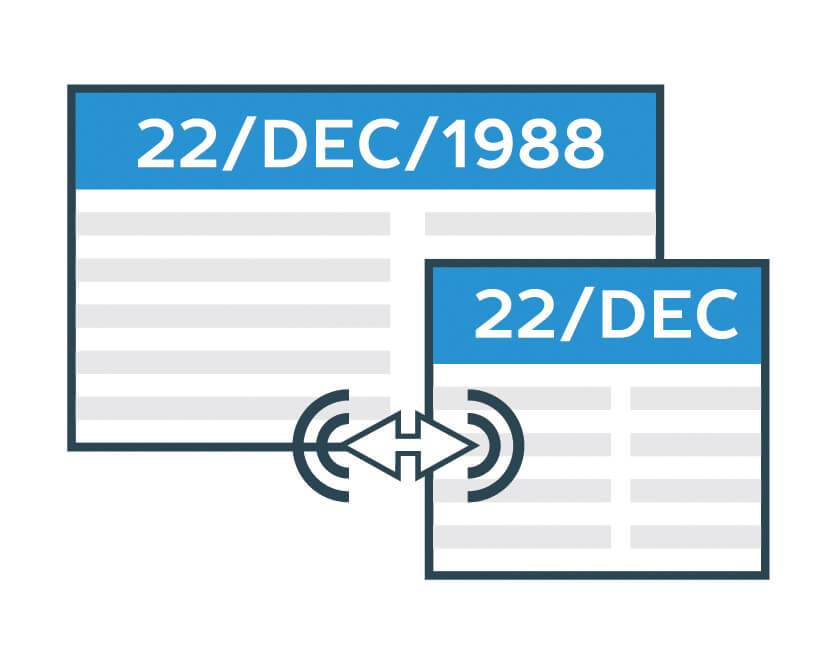
One of the main features of the new Resource Chart is the ability to set the calendar for all resources or some of them. You can configure weekends, holidays, time of availability, beginning of a calendar year, and so on.- Check out the Calendar in the Documentation.
Smart Timeline
New Resource Chart features the improved timeline that looks nice with any data. This new Smart Timeline will be made interactive and available in Gantt Charts in the next update.- Check out the Smart Timeline in the Documentation.
Improvements:
- DVF-2277 — Custom names can now be used when mapping hierarchical data.
- DVF-2401 — All scrollbars can now be customized.
- DVF-2380 — TimeLine Header behaviour is improved.
- DVF-2399 — The ability to customize the cursor for collapse/expand buttons added.
- DVF-2467 — Zoom and Scale API are greatly improved.
- DVF-2487 — Labels placement improved.
Bug fixes:
- DVF-2465 — Problems with incorrect exporting image of DataGrid fixed.
- DVF-2276 — Gantt charts display on iPad problems fixed.
- DVF-2486 — Disappearing scroller problem fixed.
- DVF-2488 — Markers are now properly displayed in child elements.
- DVF-2491 — Tooltips cutting off issues fixed.
- DVF-2489 — Mousewheel scrolling problems fixed.
- DVF-2492 — Warnings no longer appear in console when a click with the shift key happens.
- DVF-2534 — All tooltip methods now work as expected.
- DVF-2400 — Collapsed state can now be properly set to any element.
AnyGantt version 7.11.1
Released August 30, 2016Improvements:
- DVF-2119 — Legend width/height behavior improved.
- DVF-2362 — Scatter Series behaviour made consistent with other series.
- DVF-2261 — Credits behaviour improved.
- DVF-2346 — appendTheme() method added for easier management of themes.
- DVF-2079 — Beta version of the Data Adapter Module added for easier management of external files.
- DVF-2307 — Export Server can now return images as base64 strings or as shareable links.
Bug fixes:
- DVF-2352 — XML Schema validity problems fixed.
- DVF-2360 — Various minor Export Server issues fixed.
- DVF-2358 — Various minor Interactivity issues fixed.
- DVF-2376 — Inconsistent zIndex behaviour fixed.
- DVF-2338 — Various XML serialization/deserialization fixed.
- DVF-2337 — Various JSON serialization/deserialization fixed.
- DVF-2327 — toXML() deserialization method no longer adds unnecessary data into XML.
- DVF-2351 — Problems with inheritance of PERT Chart settings fixed.
- DVF-2344 — PERT Chart export CSV issues fixed.
AnyGantt version 7.11.0
Released Jul 27, 2016
Pert Chart
Pert Chart (Program evaluation and review technique) is added to AnyGantt Package. Pert Chart is a great decision-making tool designed to save time in achieving end-objectives. Flexible settings of common chart elements such as milestones (events) , tasks (activities) and critical path allow to integrate Pert Chart in a project management solution of any kind.- Take a look at Pert chart in the Gallery.
- Check out Pert chart in the Documentation.
AnyGantt version 7.10.1
Released May 31, 2016Bug fixes:
- DVF-2170 — Solved compatibility issues between AnyChart UI and other AnyChart products.
- DVF-2017 — Solved compatibility issues with old versions of ExtJS (3.4 and less).
AnyGantt version 7.10.0
Released Apr 27, 2016New features:
- DVF-2122 — Row Collapse/Expand Event Added to Datagrid.
AnyGantt version 7.9.1
Released Feb 18, 2016Bug fixes:
- DVF-1972 — Fixed bug with connectors removing in Live Edit mode.
- DVF-1979 — Solved issues with PDF export function.
- DVF-1982 — Fixed issues with Line, Range and Text Markers while scrolling.
- DVF-1986 — Fixed bugs with Live Editing in iFrame case.
AnyGantt version 7.9.0
Released Jan 27, 2016
Localization Support
Our new Localization Engine localizes dates and numbers according to the settings of choice. All the functions available work both with the input data and displayed data. Our Localization Engine can be used in custom formatting functions of AnyChart as well as apart from AnyChart to localize your own UI elements. To simplify the integration process, we have prepared more than 180 localization files for various regions of the world.- Check out Localization Support in the Documentation.
Event Markers
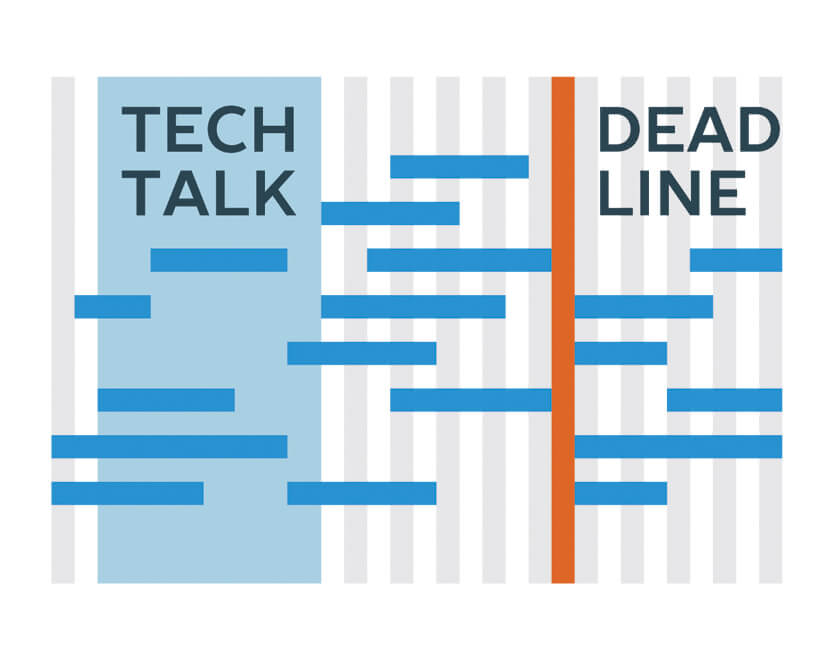
Even Markers is an excellent feature for displaying time intervals and important events on a Gantt Chart.- Take a look at Event Markers in the Gallery.
- Check out Event Markers in the Documentation.
Timeline Markers (Multiple Milestones)
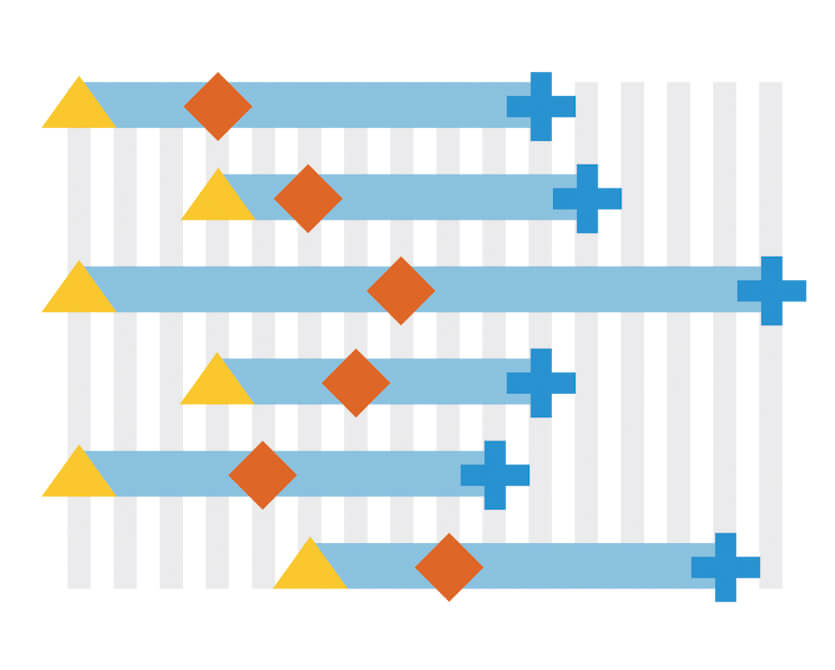
Timeline Markers are aimed for displaying various events in processes - such as receiving a payment, specifying a task, meeting a customer, etc.- Take a look at Timeline Markers in the Gallery.
- Check out Timeline Markers in the Documentation.
Improvements:
- DVF-1808 — Improved default visual settings for Gantt Charts.
- DVF-1809 — Added an option to delete connectors in the Live Edit mode.
Bug fixes:
- DVF-1800 — Fixed a bug that caused the rowSelect event to retrigger on an already selected row.
- DVF-1946 — Fixed a bug with incorrect pointIndex in an event object.
- DVF-1947 — Fixed an error that prevented an event to be dispatched when a point was unselected.
- DVF-1948 — Fixed issues with highlighting a period in the Live Edit mode.
- DVF-1949 — Fixed a bug with scrolling a chart when it was displayed in an iframe.
AnyGantt version 7.8.0
Released Nov 2, 2015New features:
- DVF-410 — String, Date/Time and Number text formatting helper functions added.
- DVF-1558 — AnyGantt Editing mode and UI, read more in Gantt Interactivity and Gantt Live Edit API and UI articles.
AnyGantt version 7.6.0
Released Aug 3, 2015New features:
- DVF-1528 Now double click on Data Grid Column border resets column width to default value.
- DVF-1532 Added ability to draw Task base line element above other Task elements, see API Reference for details.
- DVF-1545 Added Data Grid row/ column stroke settings and Time Line row/ column stroke settings.
- DVF-1546 AnyGantt now supports format feature for Data Grid Columns, see API Reference for details.
Bug fixes:
- DVF-1531 Solved issues with endless Data Grid and Time Line vertical lines.
- DVF-1569 Fixed bug with credits position.
AnyGantt version 7.5.0
Released Jun 17, 2015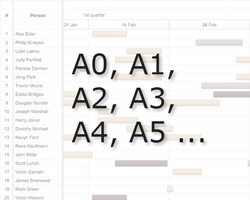
Printing
Printing method allows you to make a full-page print of a Chart. It supports eight paper size formats: US Letter, A0 - A6 and the portrait/landscape switch.- Check out Print Feature in the Documentation.

Events
Events allow to handle such user actions as " rowClick", " rowMouseOver", " rowMouseMove", etc using .listen() and .listenOnce() methods. You can override default chart interactivity, using these methods.
XML/JSON/CSV Data Support
XML, JSON can be used data and settings input formats, and CSV for data input. XML and JSON schemas are available.- Check out XML/JSON/CSV Data Support in the Documentation.
Summary Tasks Auto-Calculation
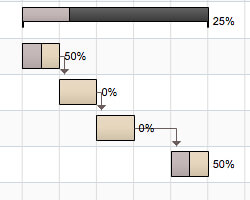
" actualStart", " actualEnd" and " progressValue" data fields of grouping tasks elements become optional. If they are missing, auto-calculation is done, based on the tasks in a group.- Take a look at Summary Tasks Auto-Calculation in the Gallery.
AnyGantt version 7.4.0
Released Mar 30, 2015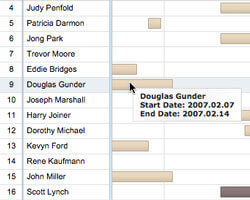
Tooltip feature for all Timeline Elements
Tooltips can be added to all timeline elements (such as resources, tasks, and periods). The appearance and format of Tooltips can be customized as always.- Take a look at Tooltip feature for all Timeline Elements in the Gallery.
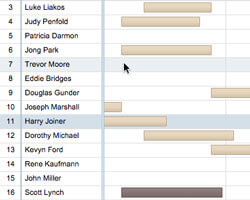
Possibility to Hover/Select Gantt Chart Rows
Gantt charts are now more interactive and responsive in use. You can adjust both the appearance of the selection and the special settings for the selected elements (such as resources, tasks, and periods).- Take a look at Possibility to Hover/Select Gantt Chart Rows in the Gallery.
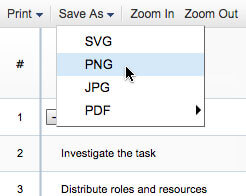
Gantt Chart Toolbar Panel
Just a few lines of code now allow you to create an UI-panel that helps to Print, Export to pictures, Zoom In/Out, Expand or Collapse.- Take a look at Gantt Chart Toolbar Panel in the Gallery.
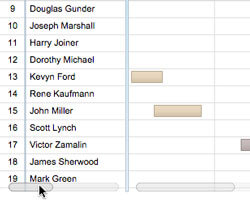
Horizontal Scroll in DataGrid
A DataGrid now can be horizontally scrolled. Have a look at this feature through the link below.- Take a look at Horizontal Scroll in DataGrid in the Gallery.
AnyGantt version 7.3.1
Released Jan 21, 2015- The Tooltips feature for Resource and Project Charts.
- Data grid and timeline rows highlighting.
- Improvements of scrollbar style.
AnyGantt version 7.3.0
Released Dec 15, 2014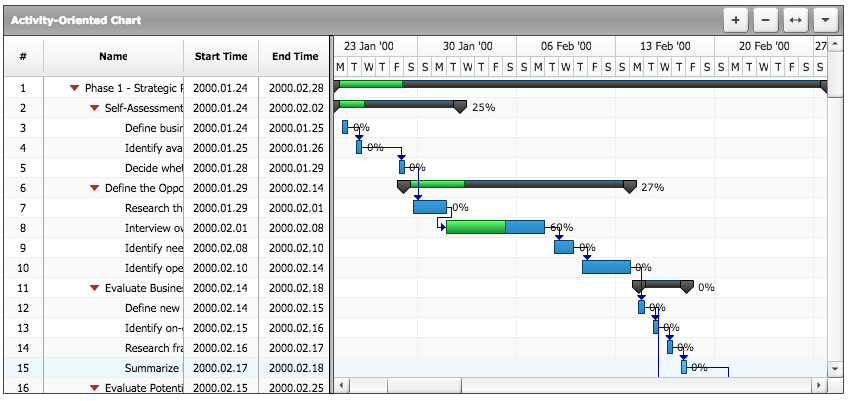
Project Gantt Chart
Project Gantt Chart is intended for showing a progress of completion of a single task or a group of tasks, taking into consideration their planned time periods and actual ones.- Check out Project Gantt Chart in the Documentation.
Resource Gantt Chart
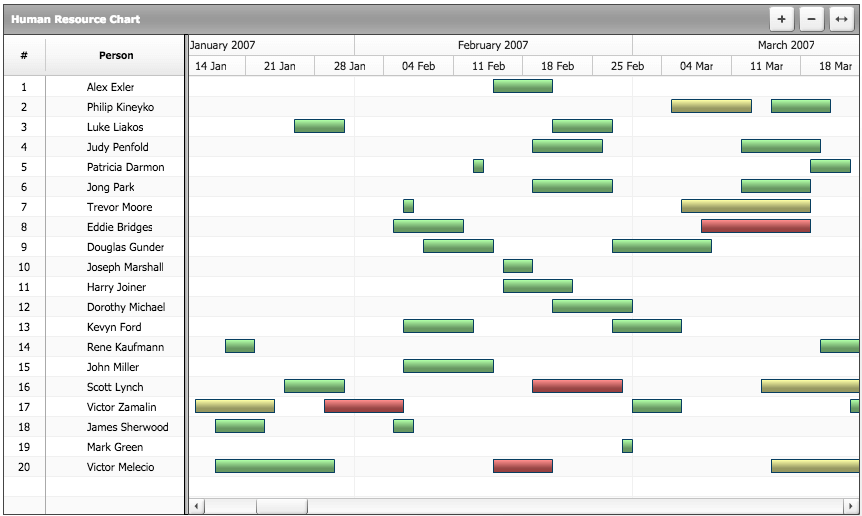
Resources Gantt Chart is intended for showing the resources you have and spreading these resources along the timeline (into periods).- Check out Resource Gantt Chart in the Documentation.
Rich JavaScript API
All AnyGantt settings can be changed dynamically at any moment. Create/Read/Update/Delete Data Manipulation, Zooming and Scrolling, Collapse and Expand Tasks.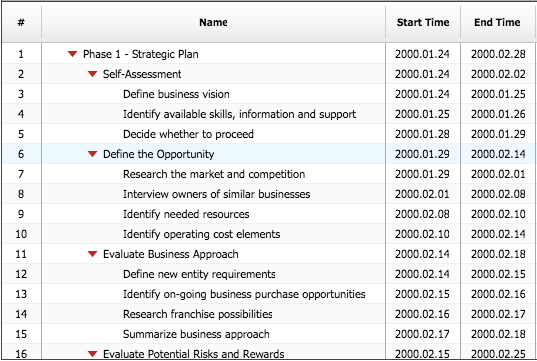
Data Grid as a Standalone Feature
All visual elements of AnyChart 7.x version can be used as a standalone features and Data Grid is not an exception.- Check out Data Grid as a Standalone Feature in the Documentation.
Tree Data Model Feature
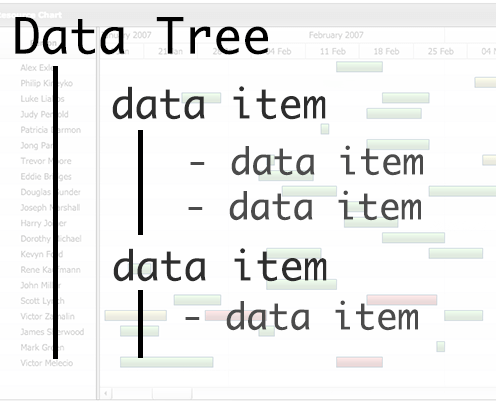
Tree structure is quite useful way of implementing data which assume tree like hierarchy with parent/child division. Such structure visualize data nodes connections thus simplifies data adjusting and improve data organization.- Check out Tree Data Model in the Documentation.