We use cookies to ensure that we give you the best experience on our website. If you continue to use this site we will assume that you are happy with it. Read more about our Privacy Policy and Cookie Policy
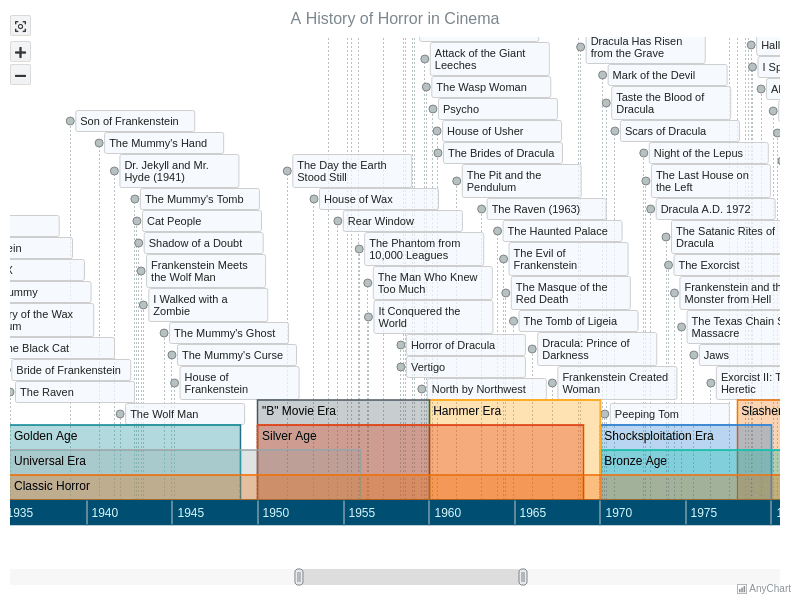
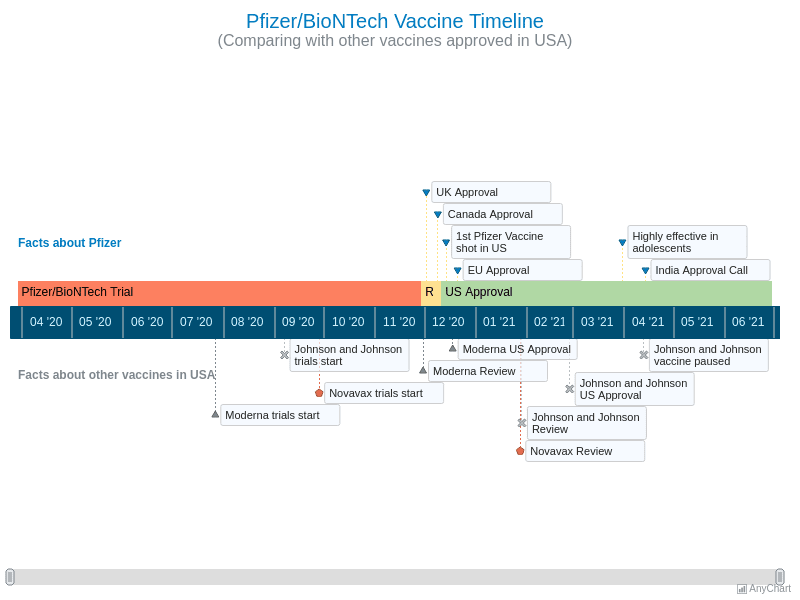
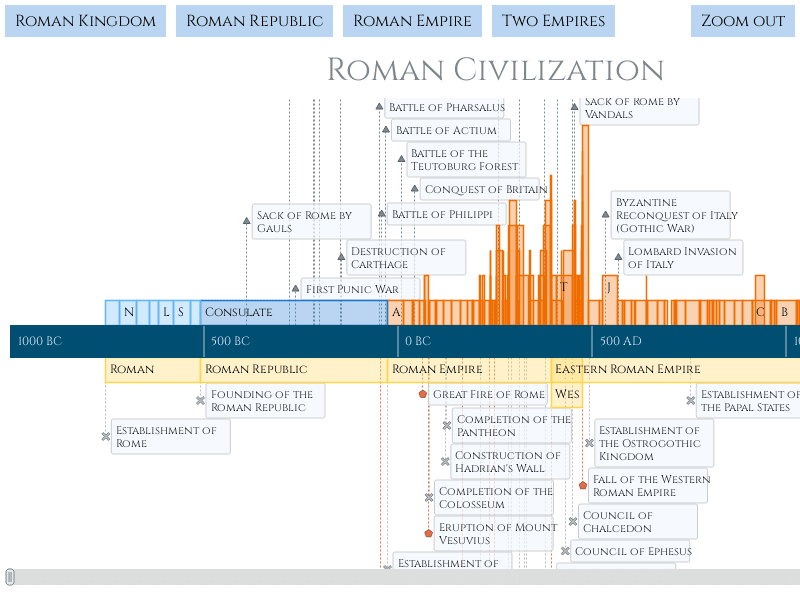
Timeline charts display events and date ranges on a horizontal time axis, combining milestone markers with period bars. Explore project plans, historical eras, and event sequences with zoom and scroll navigation.