We use cookies to ensure that we give you the best experience on our website. If you continue to use this site we will assume that you are happy with it. Read more about our Privacy Policy and Cookie Policy
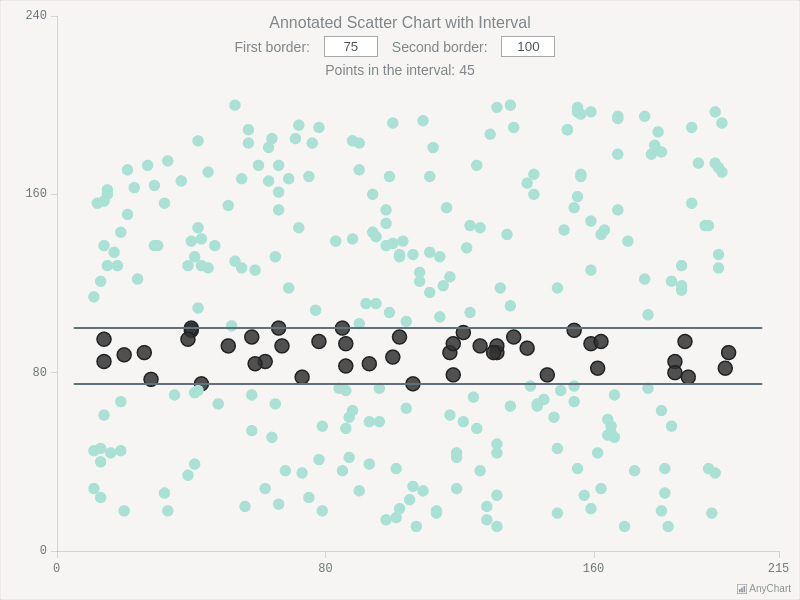
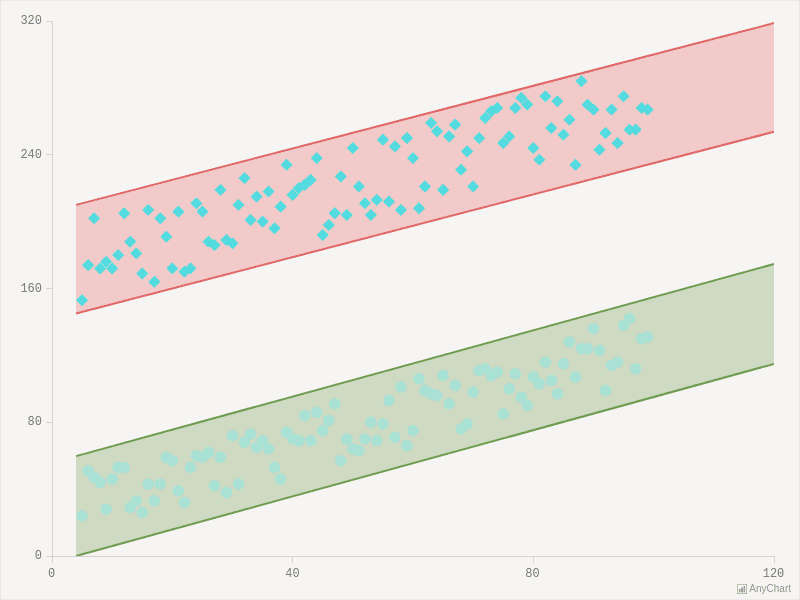
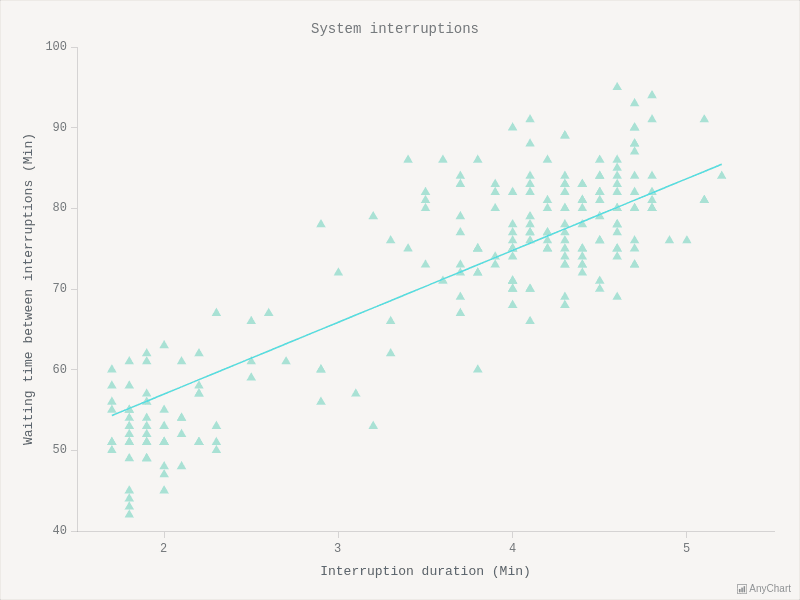
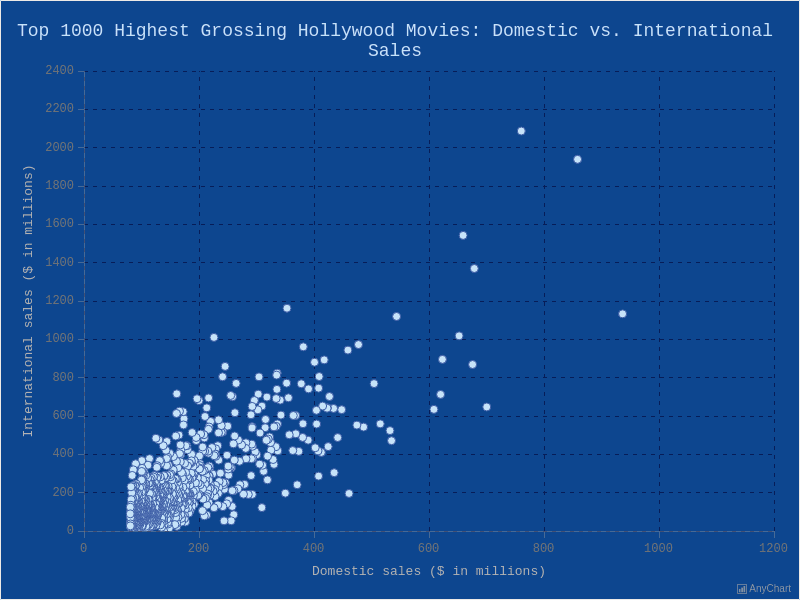
Scatter charts plot individual data points on an X-Y plane to reveal correlations and distributions. Explore marker, bubble, and line scatter types with logarithmic axes, multiple Y-axes, and date-time scales.