The very first version of AnyChart hit the shelves more than 10 years ago, check out what our products went through and see what's new in the most recent update.
Version 8.x History
AnyStock version 8.14.0
Released Nov 19, 2025Improvements:
Licensing update
We updated the licensing system. If you have any questions about your license, please reach out to our team.
Bug fixes:
DVF-4502 — Chart crash on resize
Fixed an issue causing the chart to crash when its height was too small and range-based indicators were applied
AnyStock version 8.13.1
Released Jun 17, 2025Improvements:
- Minor improvements and updates.
AnyStock version 8.13.0
Released Sep 24, 2024Improvements:
- DVF-4689 — Stock scrolling and panning behavior significantly improved
Bug fixes:
- DVF-4688 — Issues causing stock charts to freeze on mobile devices fixed
AnyStock version 8.12.0
Released Dec 4, 2023Improvements:
- DVF-4676 — Stock plot axis ticks length issue fixed and now can be set as a percent
AnyStock version 8.11.1
Released May 10, 2023
New Technical Indicators
We're thrilled to announce that our JavaScript stock charts now come with three new out-of-the-box technical indicators in addition to the dozens already supported:- Aroon Oscillator makes it easy to measure the strength of a trend by subtracting the Aroon Down from the Aroon Up.
- Coppock Curve helps identify potential long-term buying opportunities in the stock market by combining the 11-month and 14-month rate of change and smoothing it with a 10-period WMA.
- Weighted Moving Average (WMA) is especially useful for analyzing short-term trends in stock prices by placing a greater emphasis on recent data points.
- Take a look at Aroon Oscillator in the API.
- Take a look at Coppock Curve in the API.
- Take a look at WMA in the API.
Bug fixes:
- DVF-4607 — Stock: Point-related event issues fixed
- DVF-4643 — Stock: RSI calculation issue fixed
- DVF-4666 — Stock: Label annotation issue fixed
AnyStock version 8.11.0
Released Dec 7, 2021Improvements:
- DVF-4564 — Plot controls ( fullscreen/ moveup/ movedown) function can be used via API methods
- DVF-4607 — Series point-related events are implemented
Bug fixes:
- DVF-4578 Stock: VWAP indicator issue fixed
- DVF-4567 Stock: mobile browsers issue fixed
AnyStock version 8.10.0
Released May 26, 2021Bug fixes:
- DVF-4553 — Low scale tick values issue fixed
AnyStock version 8.9.0
Released Sep 29, 2020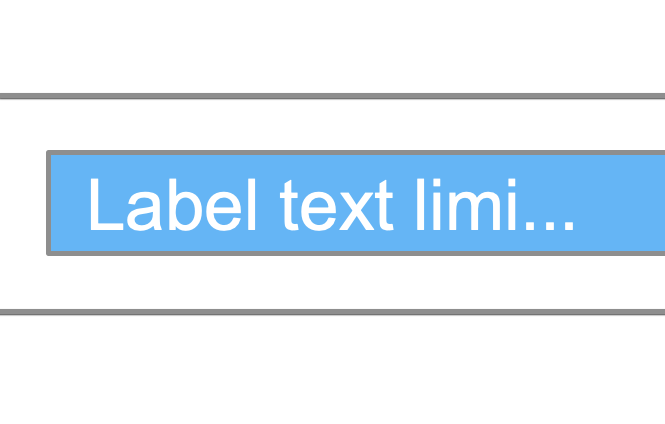
DVF-4373 — Labels text length
Added an option to limit the number of characters in labels for easier control over the chart display.- Take a look at maxLength() in the API.
DVF-4383 — Client-side CSV/XLSX export
CSV/XLSX can now be exported on client-side, without the help of an export server.
DVF-4432 — Finitive trend channel annotation
New drawing tool: Finite trend also known as parallel channel.- Take a look at Annotated OHLC Chart in the Gallery.

DVF-4461 — Volume-weighted average price indicator
New technical indicator: Volume-weighted- Take a look at Volume Weight Average Price Indicator in the Gallery.
Bug fixes:
- DVF-4429 — DVF-4430 Client side exports issues fixed
- DVF-4421 — ADL indicator calculation issue fixed
- DVF-4450 — Crosshair issue fixed
AnyStock version 8.8.0
Released May 22, 2020
DVF-4386 — Text shadow effect
Most of the text elements got an option to tune text shadow with the textShadow() method.Shadow effect can help with text display on certain background colors or give your visualizations more wow-effect.
- Take a look at Stock Chart with Labels Annotations in the Gallery.
Bug fixes:
- DVF-4252 — Event Markers disabling issue fixed.
- DVF-4361 — Plots disabling issue fixed.
AnyStock version 8.7.1
Released Dec 17, 2019Bug fixes:
- DVF-4315, DVF-4325 — Client-side export issue
- DVF-4319 — Hover cursor on legend
- DVF-4341 — Selection Marquee issue
- DVF-4252 — EventMarker's connectors issue
Improvements:
- DVF-4320 — Disable credits over theme
AnyStock version 8.7.0
Released Aug 7, 2019
DVF-4247 Client-Side Export
We've added the client-side export feature to all our JavaScript charting libraries - AnyChart, AnyStock, AnyGantt, and AnyMap. This will allow you to have your data visualizations saved as images (SVG, PNG, and JPG) and PDF documents without a roundtrip to the server, by leveraging the built-in browser features for a seamless JS chart export, fast and secure.
DVF-3947 — Stock UI Controls: Swap and Maximize
The AnyStock JS library is now provided with three new UI controls in the form of buttons - "Up", "Down" and "Maximize". The buttons make it easy for the viewer, market data analyst or trader, to swap the adjoining stock charts by moving one of them up or down, or maximize a certain visualization so it fills the entire page.
DVF-4261 — Stock Plot Splitter
A splitter is now automatically created between stock chart plots. It enables the viewer to change the relative height of the charts by dragging them up or down. This feature can facilitate data analysis when multiple stock or financial charts are drawn on one page one above the other, allowing the viewer to make a (currently) more important visualization bigger than the others.
DVF-4228 — Infinite Range Annotations
In release 8.7.0, we've also delivered two new annotations to the AnyStock library. These are infinite ranges - horizontal and vertical. So now they can be drawn on stock and financial charts powered by AnyStock using a ready-to-use UI, allowing you to avoid coding them as range axis markers, and therefore to save you a lot of time and effort.- Take a look at Horizontal range annotation in the Gallery.
- Check out Horizontal range annotation in the Documentation.
- Take a look at Vertical range annotation in the Gallery.
- Check out Horizontal range annotation in the Documentation.

New Technical Indicators
Five new out-of-the-box technical indicators are now available: Envelope (ENV), Ichimoku Cloud (IKH), Price Oscillator (PPO), Rank Correlation Index (RCI) and Psychological Line (PSY).- Take a look at Technical Indicators in the Gallery.
- Check out Technical Indicators in the Documentation.
Improvements:
- DVF-4277 — Legend. Add some icons support
Bug fixes:
- DVF-4201 — Legend issues
- DVF-4259 — Rangepicker issues
- DVF-4258 — Crosshair label issues
AnyStock version 8.6.0
Released May 15, 2019Improvements:
- DVF-4140 — Sticky Y-crosshair feature added.
- DVF-3596 — AnyChart Locales Improved
- DVF-3597 — Custom Messages in locales
- DVF-4051 — Color Scale reworked - default range and "equal" flag are added.
- DVF-4073 — Auto localized context menu from the included locale
Bug fixes:
- DVF-3944 — Resize event issues fixed.
- DVF-4187 — Charts disposing improved.
AnyStock version 8.5.1
Released Feb 4, 2019Bug fixes:
- DVF-3954 — fixed stock event markers font rendering
AnyStock version 8.5.0
Released Dec 24, 2018
DVF-3076 Timescale Minimum and Maximum Gaps
Now you can set gaps at the beginning and the end of the timescale.- Take a look at Timescale Minimum and Maximum Gaps in the Gallery.
- Check out Timescale Minimum and Maximum Gaps in the Documentation.
Improvements:
- DVF-4056 — Stock single tooltip: AnyStock now supports single display mode, where tooltip is shown for separate elements of series.
Bug fixes:
- DVF-3975 — Linear scale small values calculation improved.
- DVF-3952 — Awesome oscillator coloring issue fixed.
- DVF-4024 — Stock tooltip union format issue fixed.
AnyStock version 8.4.2
Released Nov 23, 2018Bug fixes:
- DVF-3975 — extra small values issue
- DVF-4024 — tooltip format issue
AnyStock version 8.4.1
Released Oct 30, 2018Bug fixes:
- DVF-3952 — Awesome Oscillator fill coloring fixed.
AnyStock version 8.4.0
Released Oct 5, 2018
DVF-3857 — Performance issues
We have significantly improved the performance.Improvements:
- DVF-3873 — Improved rendering of legend.
- DVF-3699 — Now event markers can be bound to an arbitrary timestamp.
- DVF-3861 — Axis line markers now can dispatch mouse events.
Bug fixes:
- DVF-3900 — Now scales work correctly with small data sets.
- DVF-3850 — Improved positioning of the data area.
- DVF-3808 — The MAX button of the range selector now works correctly.
AnyStock version 8.3.0
Released Jul 10, 2018
HTML Tooltips Support
Tooltip customization is way easier now. Full support of HTML is available. You can write your own HTML code and customize tooltip visualization using CSS classes.- Take a look at HTML Tooltip in the Gallery.
- Check out HTML Tooltip in the Documentation.

Axis Markers
Axis Markers (Text Marker, Range Marker, Line Marker) are now supported in AnyStock.- Take a look at Text and Line Axis Markers in the Gallery.
- Take a look at Range Axis Markers in the Gallery.
- Check out Axis Markers in the Documentation.

Hover State Configuration
Hovered state configuration is now supported in stock charts.- Take a look at Hover State Configuration in the Gallery.
- Check out Hover State Configuration in the Documentation.

Plot Titles
Stock charts plots can have their own titles now.- Take a look at Plot Titles in the Gallery.
- Check out Plot Titles in the Documentation.

Coloring Rules and Thresholds
New ways to customize the coloring of series are added. Negative/positive colors, rising/falling colors, and the ability to specify the Color Scale with thresholds for series.- Take a look at Coloring Rules and Thresholds in the Gallery.
- Check out Coloring Rules and Thresholds in the Documentation.

Axis Labels Positioning
The positioning of axis labels inside data plots is made easier.- Take a look at Axis Labels Positioning in the Gallery.
- Check out Axis Labels Positioning in the Documentation.

New Technical Indicators
Seven new out-of-the-box technical indicators are now available: TRIX, Keltner Channel, On Balance Volume (OBV), Awesome Oscillator (AO), Heikin Ashi, VolumeMA and Price Channels.- Take a look at Technical Indicators in the Gallery.
- Check out Technical Indicators in the Documentation.
Improvements:
- Color palettes improvements
- Labels background settings improvements
- Axis markers improvements (new methods: background, padding, scaleRangeMode)
- Markers/Labels clipping improvements
- Technical Indicator range series settings improvements
Bug fixes:
- Color functions anychart.color.darken and anychart.color.lighten issues
- XML serialize scale ticks issue
- Escape/Unescape symbols in XML serialization
- Technical indicators series issues
- Min/max labels with comparisonMode works correctly now
- Small values issues
- Stock plots issues
- selectRange now works correctly after drawing
AnyStock version 8.2.1
Released Apr 16, 2018New featuresbug fixes::
- DVF-3585 — Added the allowPointSettings() method.
- DVF-3681 — Crosshair issues fixed.
AnyStock version 8.2.0
Released Mar 27, 2017
Min/Max labels
You have a unique opportunity to show the minimum and maximum values on the visible area of the chart. In this case, you realize at a glance what is happening on a particular part of the stock chart.- Take a look at Stock Min/Max labels in the Gallery.
- Check out Min/Max labels in the Documentation.

Additional Touch Support
We are glad to announce that touch support in AnyStock has been further extended! Now you can use the touchscreen to easily pinch stock charts (or any other timeline-based data visualizations) and scroll them in any direction.
New Technical Indicators
A new bunch of technical indicators is now available in the AnyStock JS library for financial data visualization: Parabolic SAR (PSAR), Money Flow Index (MFI), Momentum and Williams %R. See the roadmap of AnyStock to learn which ones are scheduled for release with the following major updates.- Take a look at technical indicators in the Gallery.
- Check out technical indicators in the Documentation.

Negative Logarithmic Scale
In release 8.2.0, we've introduced the support of negative values on the logarithmic scale. This can be helpful in creating a clearer and more comprehensive visualization when working with large data sets.
Crosshair Multiple Labels
Now you can display several crosshair labels on additional axes of the chart. Hence, it is possible to add an extra axis (e.g. one with percentage values), enable this feature and get more insights at a time while exploring such an interactive data visualization.- Take a look at Crosshair Multiple Labels in the API.
Improvements:
- X Scale Irregular intervals support
- Ability to Select Data Range by Points Count
Bug fixes:
- Disable plot issues
- Missing points issues
- Comparison mode issues
AnyStock version 8.1.0
Released Dec 20, 2017
Event Markers
Event Markers are now one of the most exciting features of the AnyStock library. It's a special type of chart markers designed to provide the best experience in showing various events on financial charts: Key Developments, Dividends, Splits, Insider Transactions, Analyst Opinion Changes and so on. This information is very important for financial analysis and has to be properly visualized. That's why we've equipped AnyStock with a very flexible and convenient set of tools for working with Event Markers.- Take a look at Stock Event Markers in the Gallery.
- Take a look at Stock OHLC Chart with Sidebar Events Feed in the Gallery.
- Check out Stock Event Markers in the Documentation.

Label Annotation
When it comes to analyzing stock data, the opportunity to add text annotations is often essential. Just like other types of annotations, a label annotation supports live editing and states, can be saved as JSON and provides a wide range of text settings.- Take a look at Stock Chart with Label Annotations in the Gallery.
- Check out Label Annotation in the Documentation.
Improvements:
- Added additional metadata for Fibonacci Annotations labels formatters to separate date/time levels from value levels.
- Improved memory allocation when running AnyChart in Node.js environment.
- String Tokens now auto-detect the type of formatting (string, number or DateTime) by token arguments. In addition, formatting types can now be defined directly using the type argument.
- Added additional meta for series in comparison mode.
Bug fixes:
- Fixed price indicator formatting issues.
- Fixed issues with annotations toJson() method call.
- Fixed issues with extra small and extra large values formatting.
- Fixed issues with unicode symbols in String Tokens (desk case #3833, TS-415).
- Fixed bug when Stock Chart xAxis labels failed to work with String Tokens (DVF-3396).
- Fixed issues with inappropriate chart rendering into containers with flex layout in Firefox.
AnyStock version 8.0.0
Released Oct 2, 2017
Modular System
Modular System is the core of AnyChart 8. It allows you to significantly reduce the size of the JavaScript running on your web page by connecting only those chart types and features that you actually use. The modular based AnyChart is perfectly compatible with popular bundling tools such as Webpack, Browserify, and so on. Use our JS Builder to easily generate a custom build.- Check out Modular System in the Documentation.

Custom JavaScript Builds
Custom JavaScript Builder is designed for assembling a JavaScript file that contains only the features and chart types you are really going to use. The AnyChart version 8.0.0 contains 30 modules and 16 themes. You can also build a file that contains your license key .- Try Custom JavaScript Builder right now
- Check out Modular System in the Documentation.

Node.js Server-side Rendering
Node.js server is a lightweight web server that provides API for generating vector graphics (PDF, SVG, or PS), bitmap images (PNG, JPG, or TIFF), PDF reports, and data in CSV and XLSX (Excel). It uses the JavaScript code as well as JSON and XML configurations as input data. The server is very easy to install and customize, you can run it on any major platform: Linux, Windows, and macOS. It is ideal for creating report systems that send charts via email or social network sharing tools.
No Data Label Feature
No Data Label Feature is an API designed to notify the chart viewer that data is not available. Data can be missing due to its absence by default or if it has been removed by means of the Data Updating API, Exclude Data Point feature, or through the interactivity.- Check out No Data Label in the Documentation.

CSV/Excel Export Reworked
By popular demand, we've remastered the algorithm for preparing CSV/Excel data for charts. Now it takes into account the chart type specific features and allows you to use multiple data sets for different series.- Check out Data Export in the Documentation.

Chart Export Settings
Now you can customize the export settings for each chart: links and descriptions for sharing on Facebook, image export options, and so on.- Take a look at Chart Export Settings in the API.
- Check out Chart Export Settings in the Documentation.
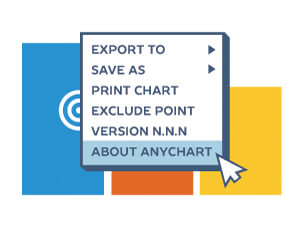
Context Menu Customization API
We've significantly simplified the process of the context menu customization. Now each item of the context menu is assigned with an ID that can be called to access the corresponding fields and settings as well as to add custom ones. We've also added the option to localize the context menu.- Check out Context Menu in the Documentation.
General API Improvements
We've substantially improved the AnyChart JS Charts API specifically for the 8th generation of our JavaScript charting libraries. Appearance settings, Grids settings , Data Mapping settings can now be made much easier. To facilitate and streamline the transition from AnyChart 7 to AnyChart 8, we've created the Migration Tool that will allow the majority of users to switch over to the new version in semi-automatic mode.
Crosshair
Crosshair is an exploratory tool that allows you to uncover exact data values hidden behind the chart. It supports two display modes out of the box: float and sticky.- Check out Crosshair in the Documentation.

Current Price Indicator
Current Price Indicator is an exploratory tool that allows you to uncover exact data values hidden behind the chart. It supports two display modes out of the box: float and sticky.- Take a look at Stock Price Indicator in the Gallery.
- Check out Stock Price Indicator in the Documentation.
Improvements:
- Chart scroller does not move during Data Streaming anymore ( Github issue 11, TS-181)
Bug fixes:
- Fixed issues with time conversion for some of DST regions (Case 3183, TS-160)
- Fixed bug with redraw of a chart on chart range picker click in ASPX projects (TS-312)