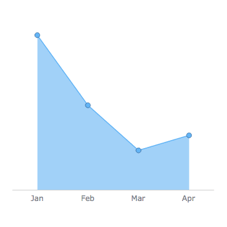
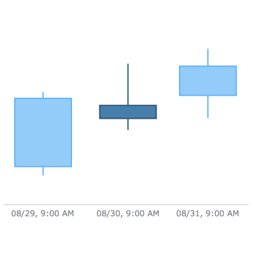
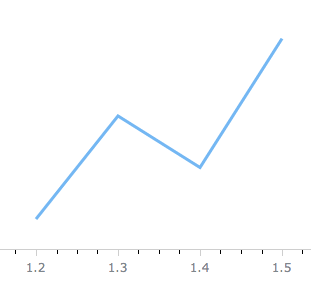
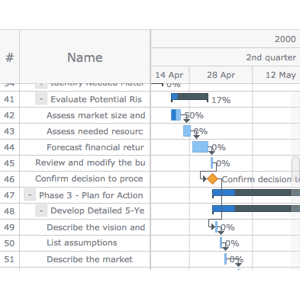
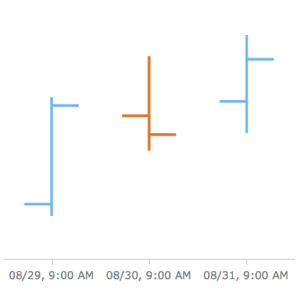
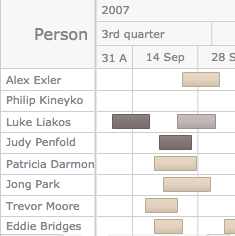
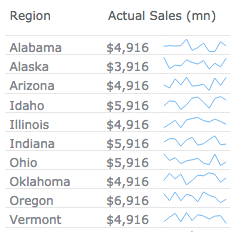
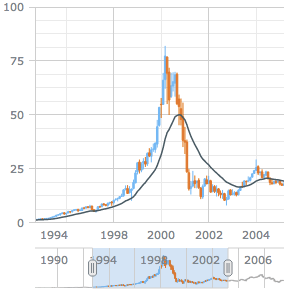
When the purpose of your data visualization is to observe the change in values of something over a specific period of time, you should consider the following chart types.
They facilitate the analysis of continuous data sets and are helpful in bringing trends into focus.