Warning!
We use cookies to ensure that we give you the best experience on our website. If you continue to use this site we will assume that you are happy with it. Read more about our
Privacy Policy
and
Cookie Policy
Vertrieb:
+1 (279) 499-2767 (USA)
oder
+44 (800) 0584677 (Europa)
Deutsch
Português
日本語
العربية
汉语
Español
Русский
English
Kunden-Login
Toggle navigation
Produkte
AnyChart
AnyStock
AnyMap
AnyGantt
Mobile
Qlik Extension
Features
Ressourcen
Geschäftslösungen
Technische Integration
Chartopedia
Tutorials
Support
Unternehmen
Über uns
Kunden
Erfolgsgeschichten
Weitere Erfahrungsberichte
News
herunterladen
jetzt kaufen
Suche
Gantt Charts
Project Gantt charts visualize task timelines, dependencies, and milestones. Explore activity-oriented schedules, planned-vs-actual comparisons, resource allocation, and server-status timelines.
Übersicht
Diagrammgalerie
Dokumentation
Roadmap
Versionsverlauf
Chart Gallery
Gantt Charts
Gantt Charts
Select a theme:
Default
Dark Blue
Light Blue
Dark Earth
Light Earth
Dark Glamour
Light Glamour
Dark Provence
Light Provence
Dark Turquoise
Light Turquoise
Coffee
Monochrome
Morning
Pastel
Sea
Wines
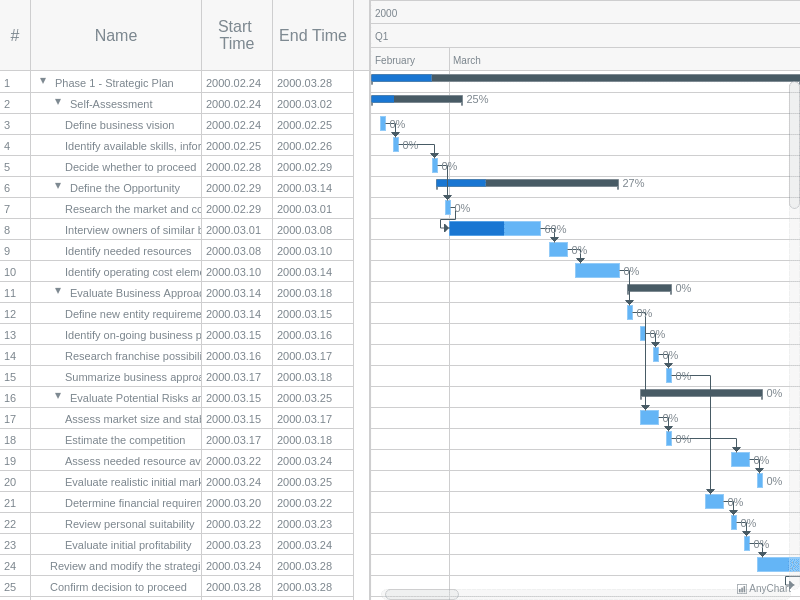
Activity-Oriented Chart
Project Gantt chart with custom data grid columns and formatted start/end activity dates.
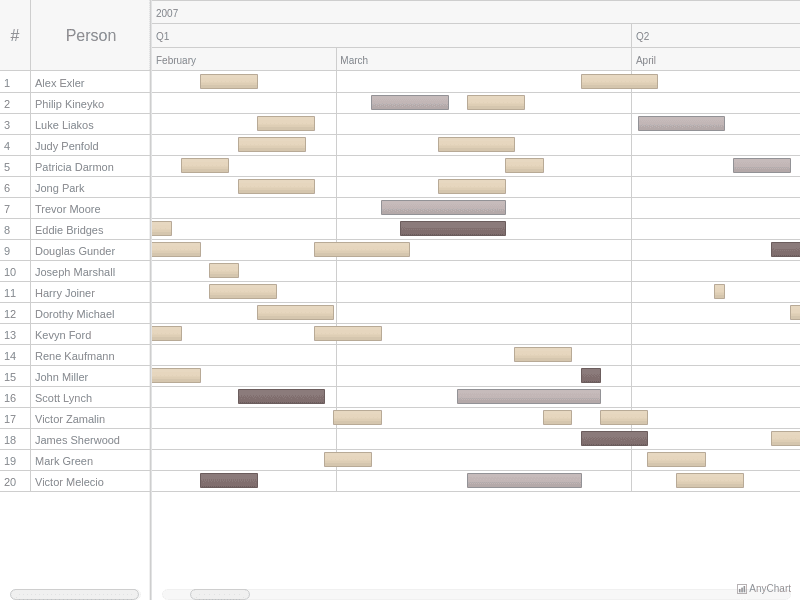
Human Resource Chart
Resource Gantt chart for personnel scheduling with custom row highlighting and person-focused columns.
Planned-vs-Actual Chart
Project Gantt chart comparing planned baseline dates versus actual execution with custom baseline columns.
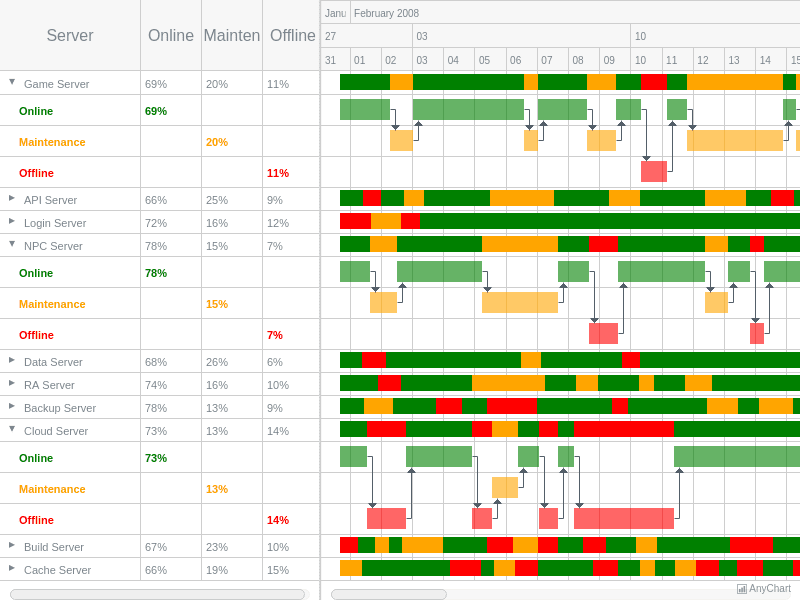
Server Status List
Resource Gantt Chart example with Conditional Coloring.
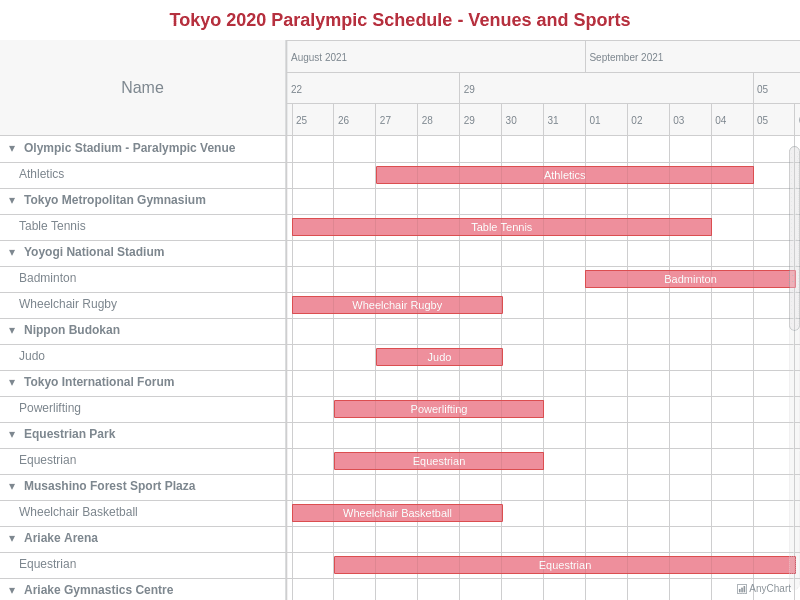
Tokyo 2020 Paralympic Schedule
A resource Gantt chart visualizing the schedule of the Tokyo 2020 Paralympics by venue and sport. Loads JSON data. Features a Japanese locale and custom settings for the labels, colors, cell size, and title.