We use cookies to ensure that we give you the best experience on our website. If you continue to use this site we will assume that you are happy with it. Read more about our Privacy Policy and Cookie Policy
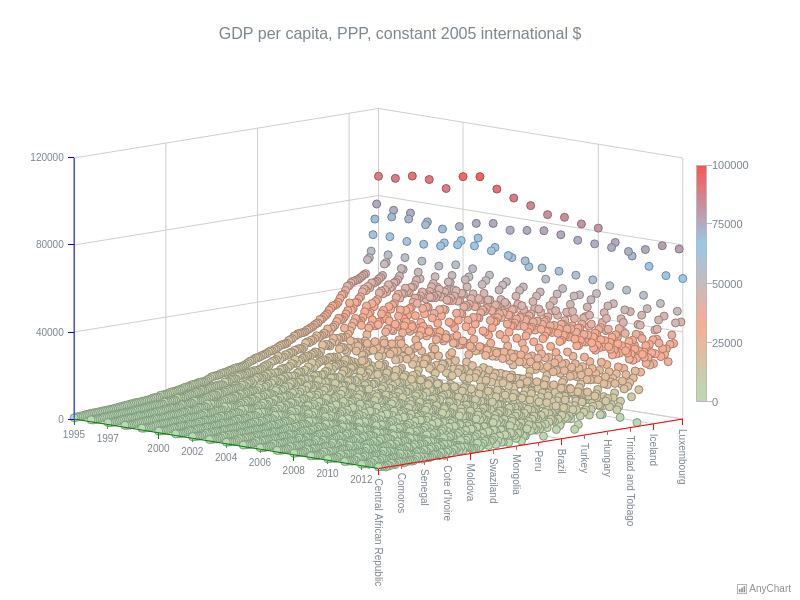
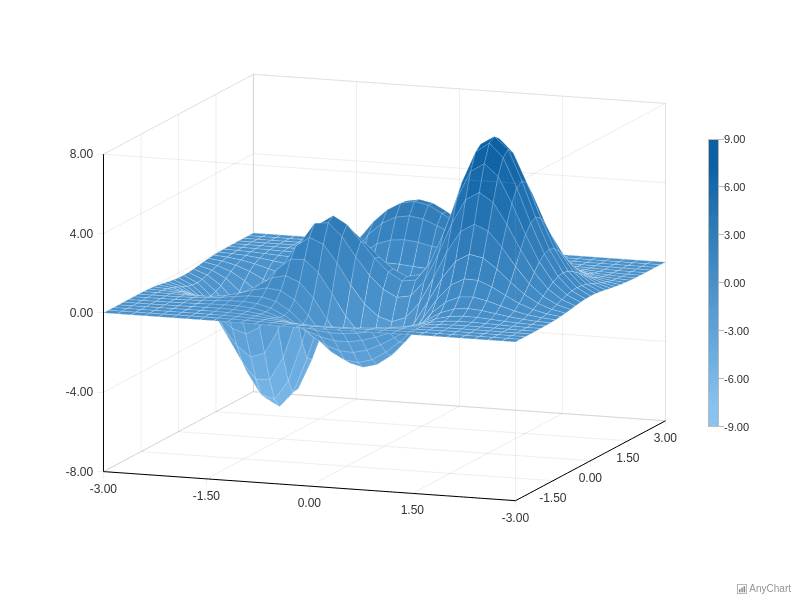
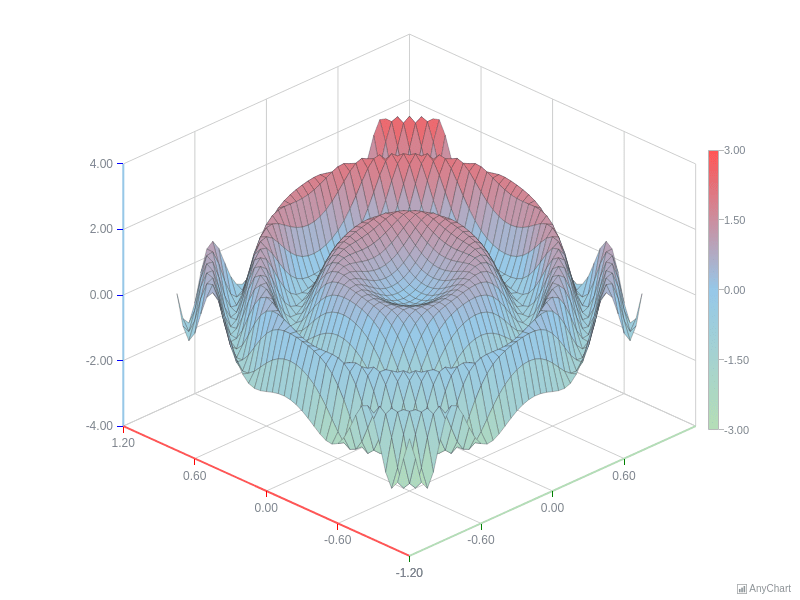
Surface charts render three-dimensional data on a continuous mesh, mapping X, Y, and Z values to height and color. Explore mathematical functions, multi-country economic data, and custom color scales.