We use cookies to ensure that we give you the best experience on our website. If you continue to use this site we will assume that you are happy with it. Read more about our Privacy Policy and Cookie Policy
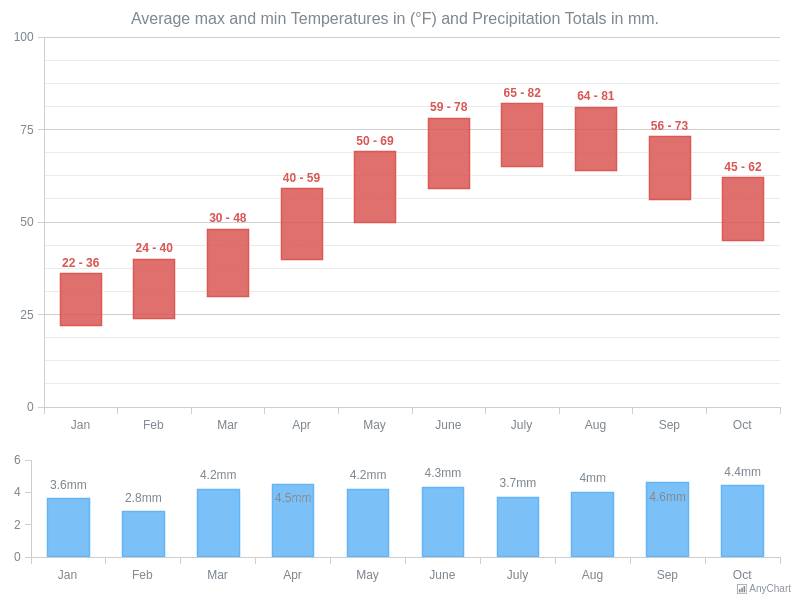
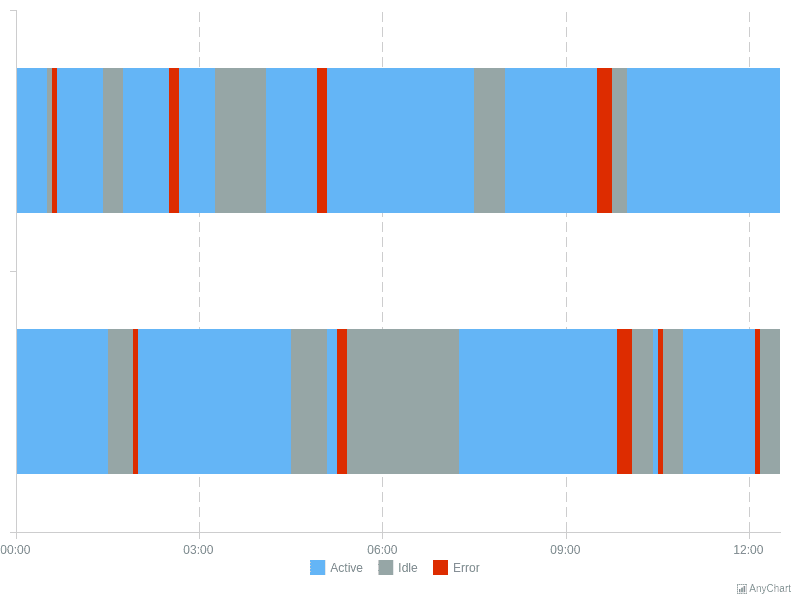
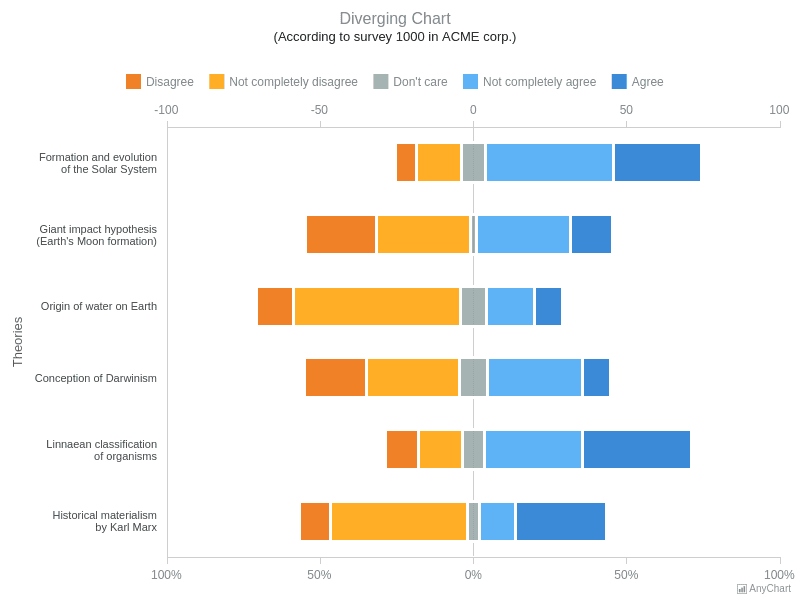
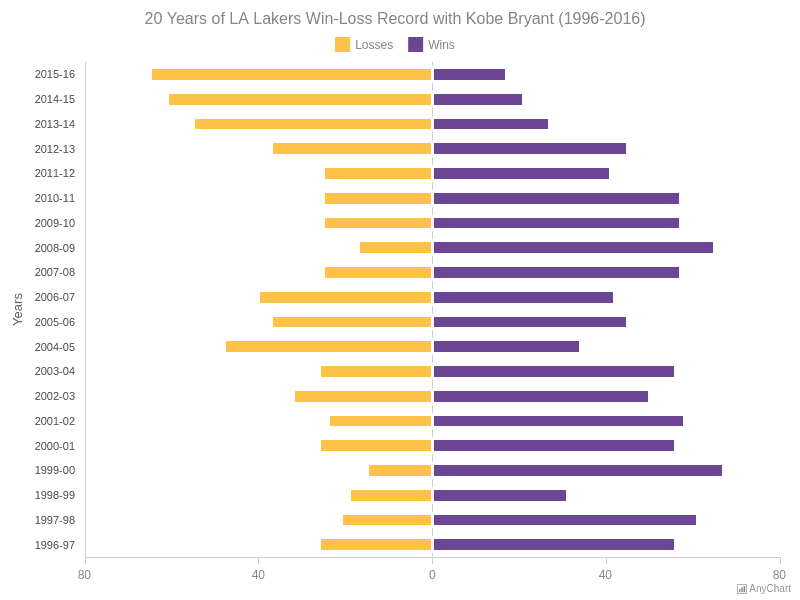
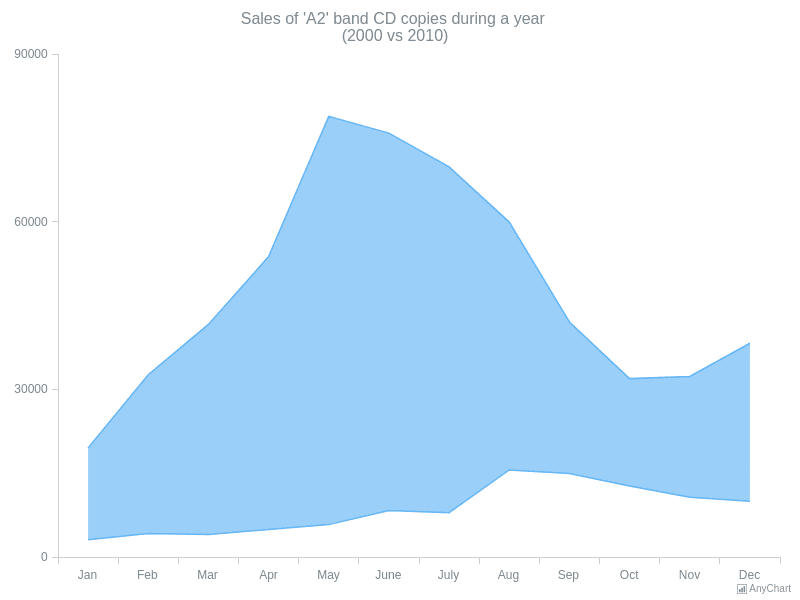
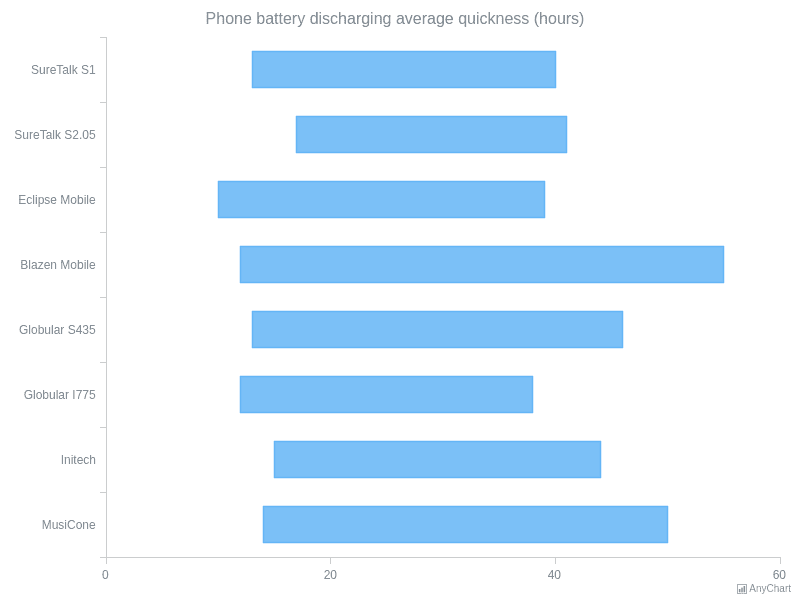
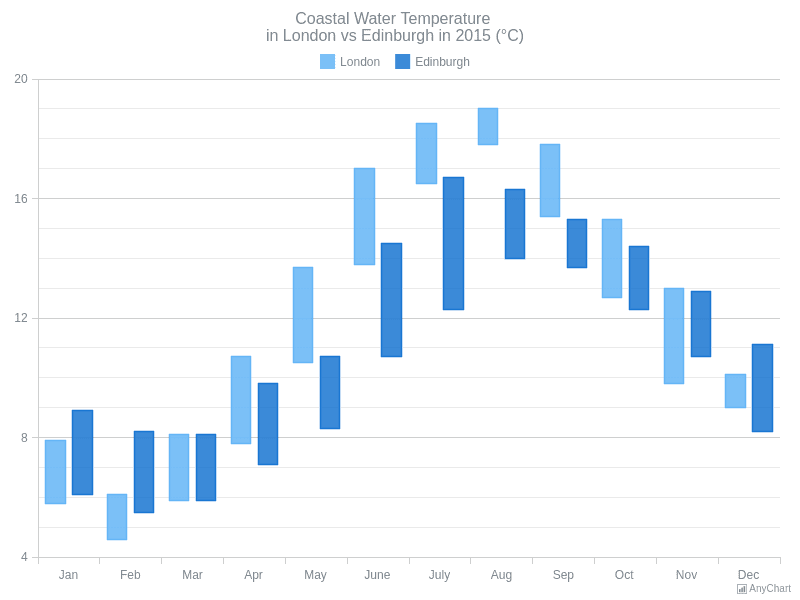
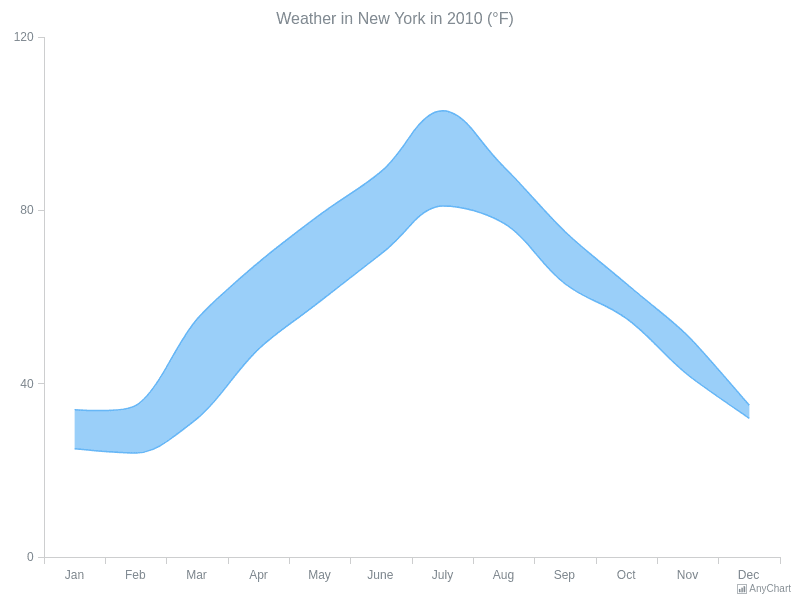
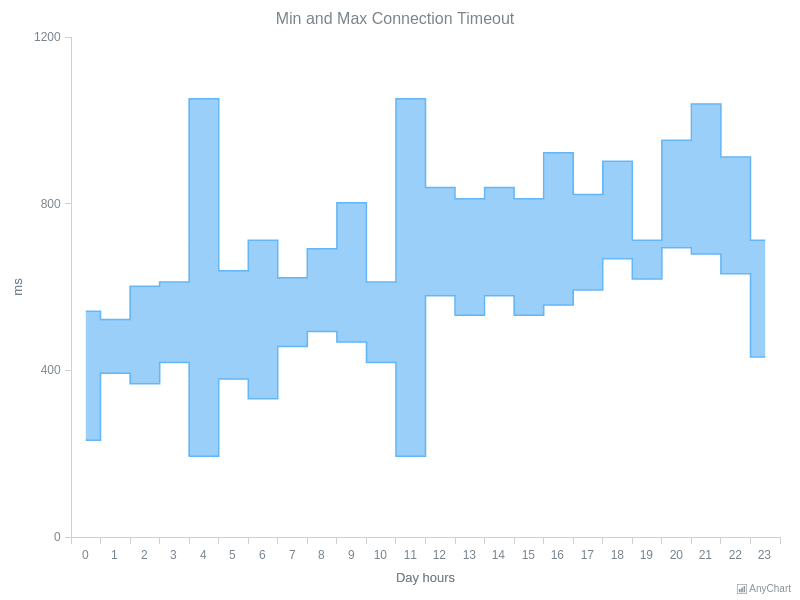
Range charts display data spans between minimum and maximum values per category. Explore range bar, range column, range area, diverging bars, and combined range-series compositions.