We use cookies to ensure that we give you the best experience on our website. If you continue to use this site we will assume that you are happy with it. Read more about our Privacy Policy and Cookie Policy
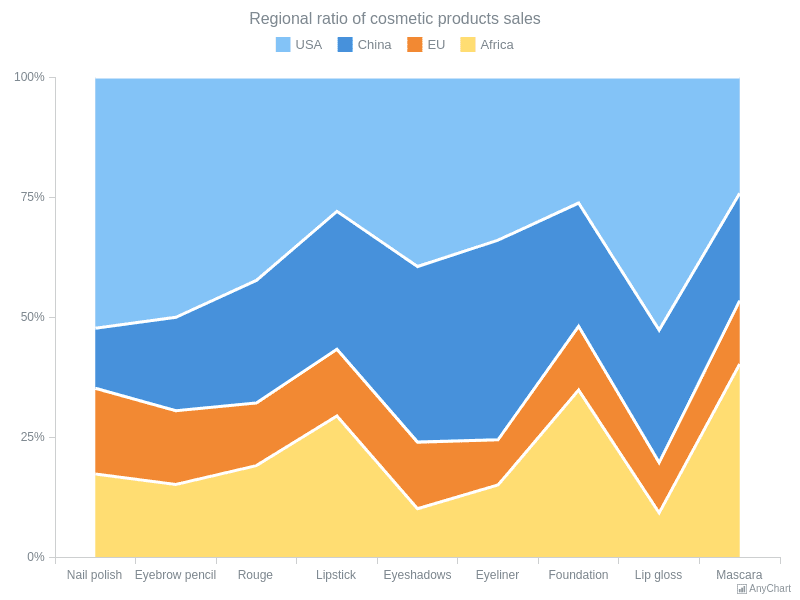
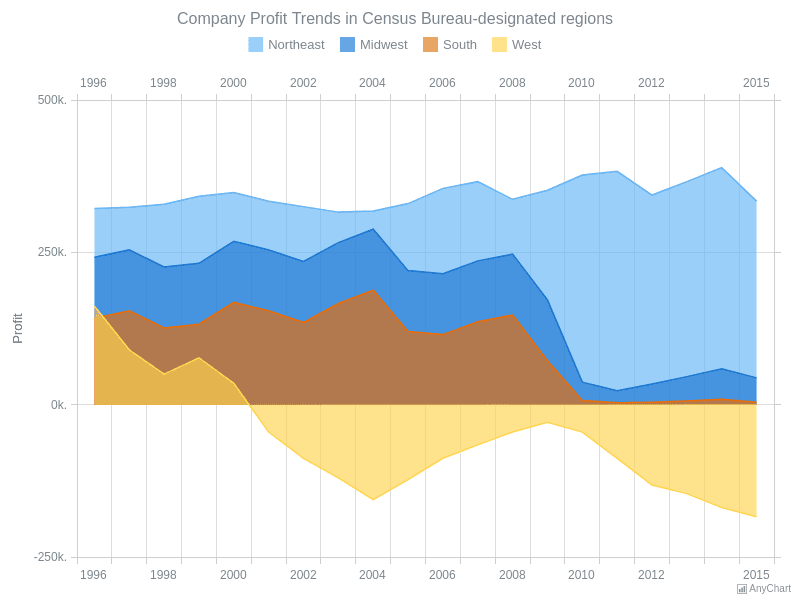
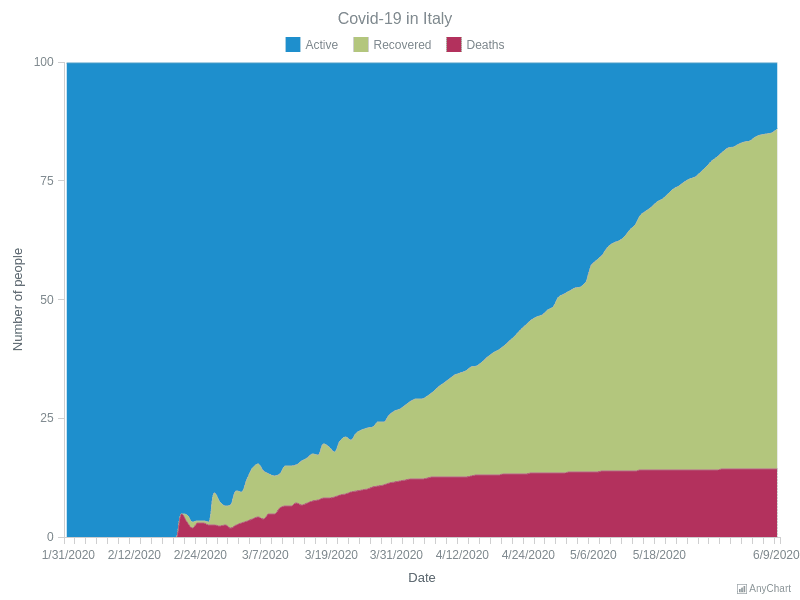
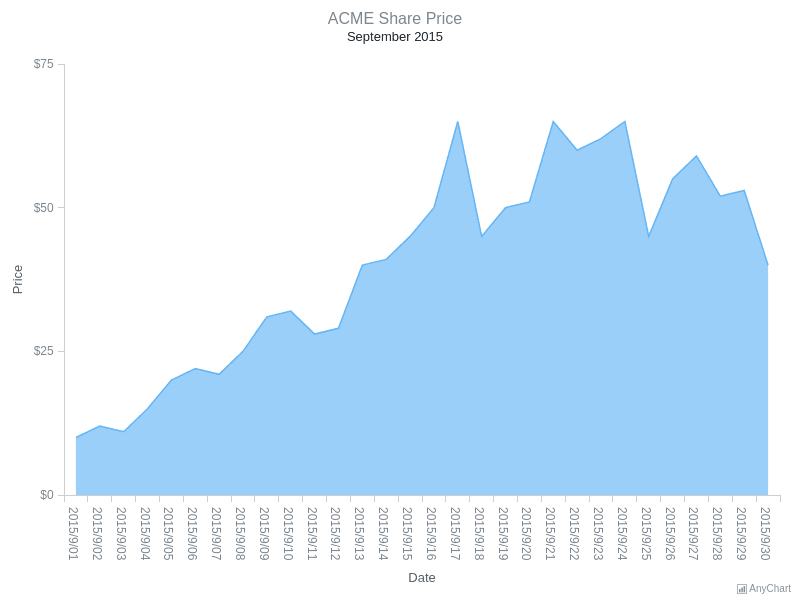
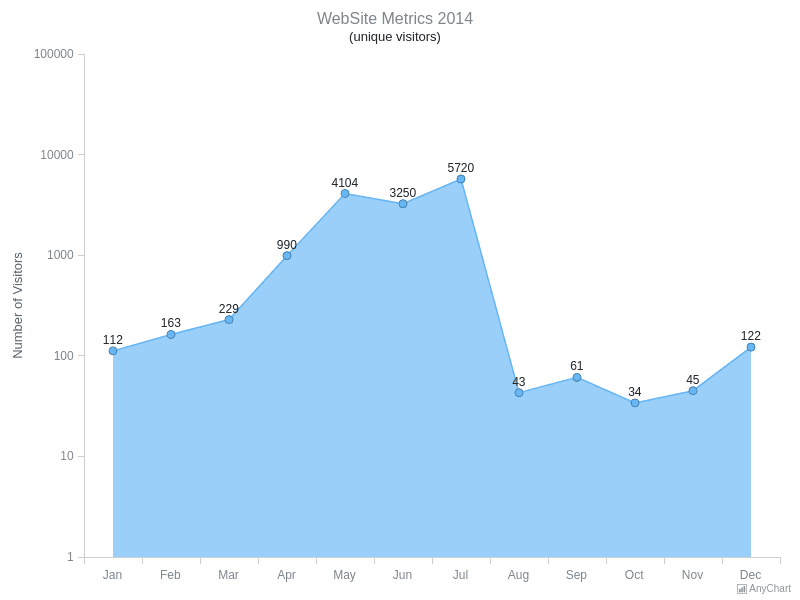
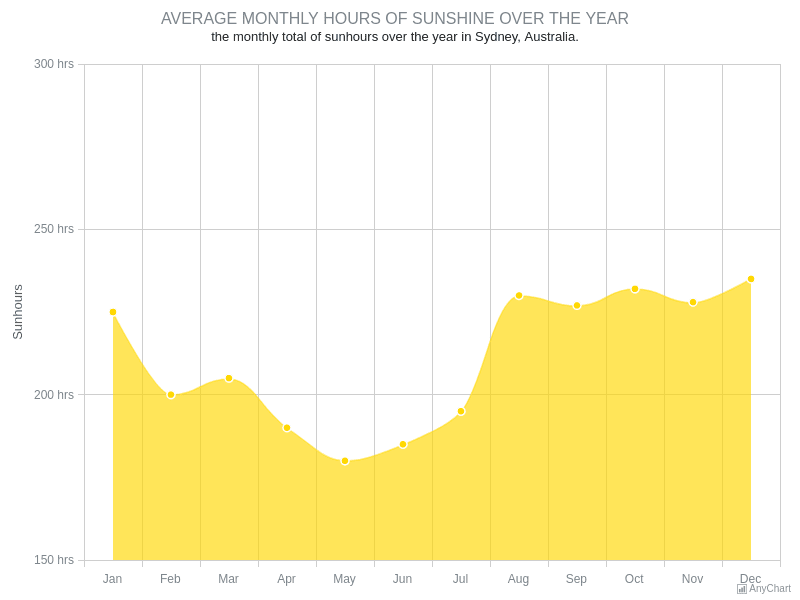
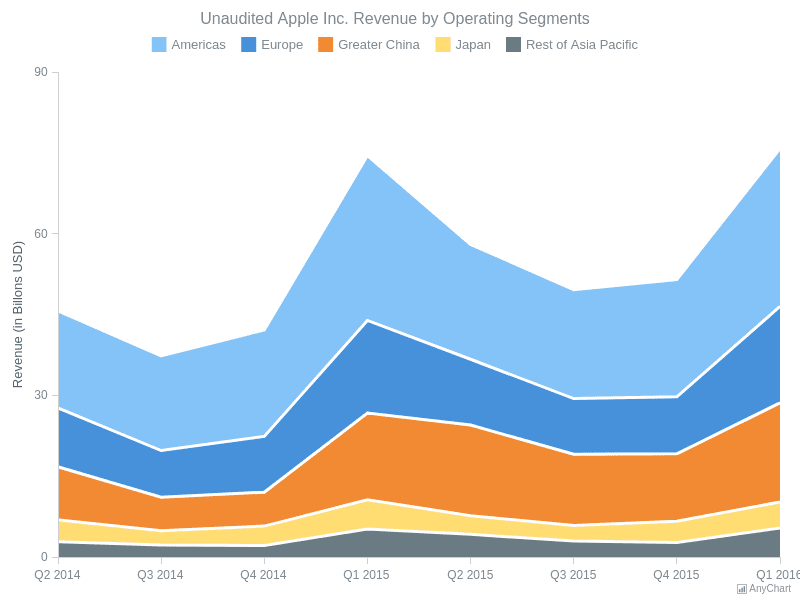
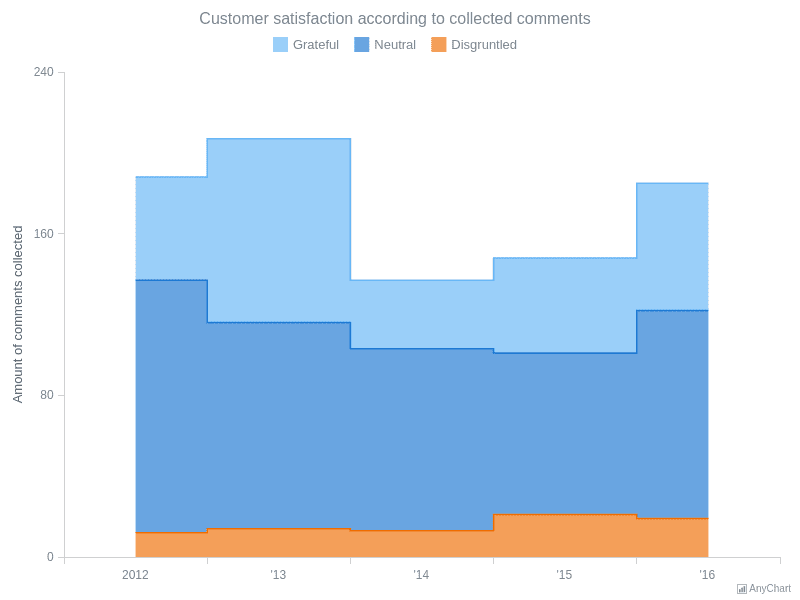
Area charts shade the region between a line series and the baseline to emphasize volume and cumulative totals. Explore single-series, multi-series, stacked, percent-stacked, spline-area, and step-area variations.