We use cookies to ensure that we give you the best experience on our website. If you continue to use this site we will assume that you are happy with it. Read more about our Privacy Policy and Cookie Policy
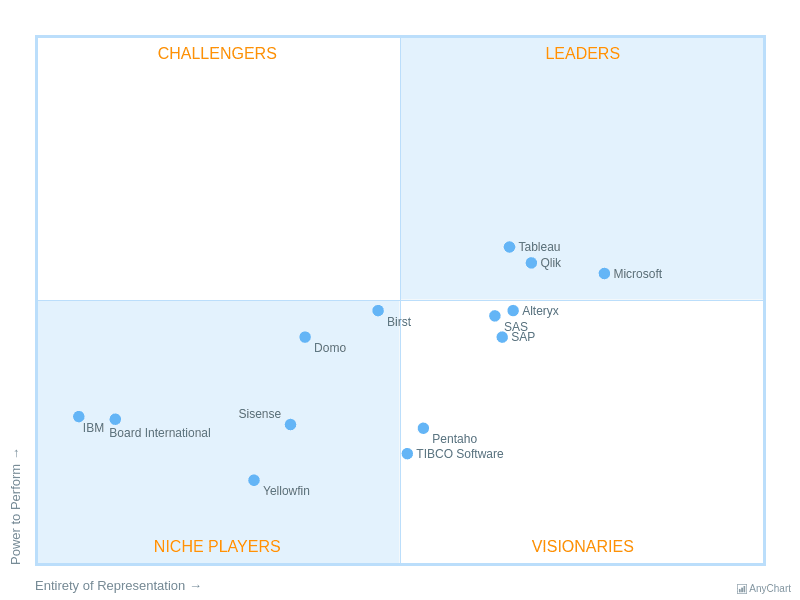
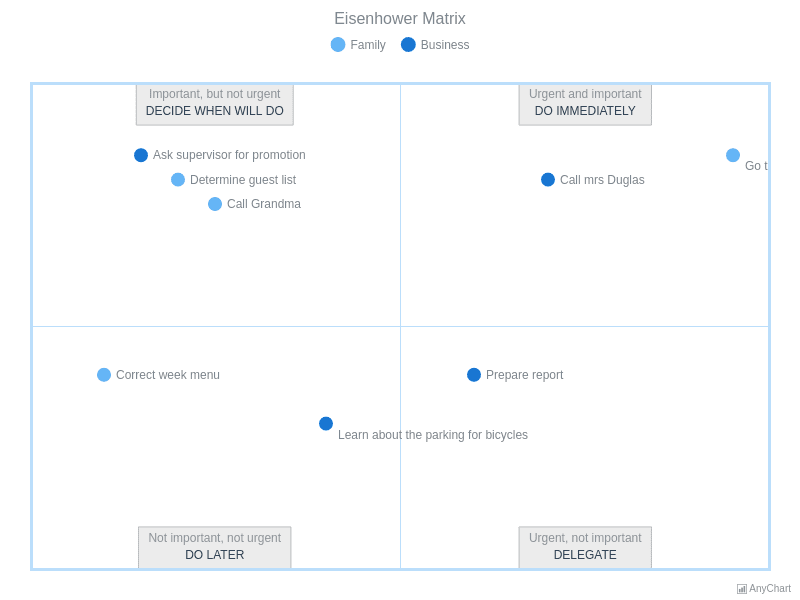
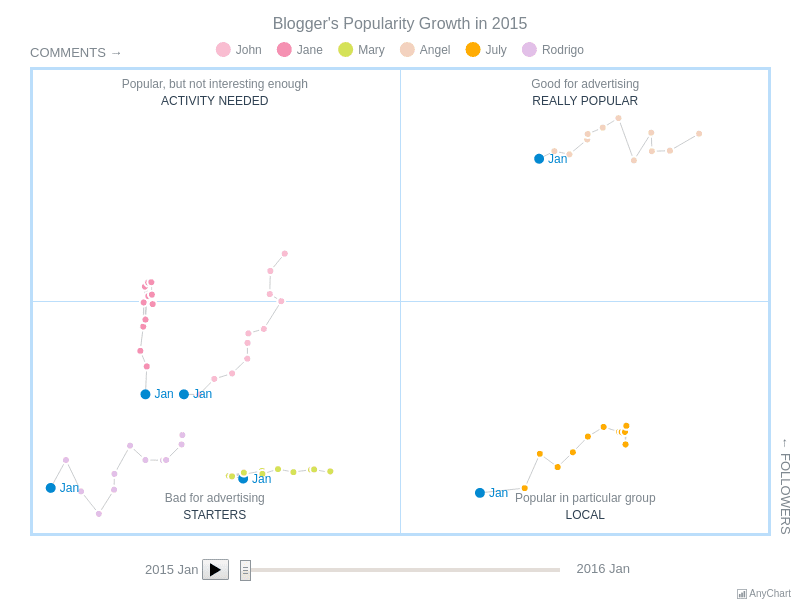
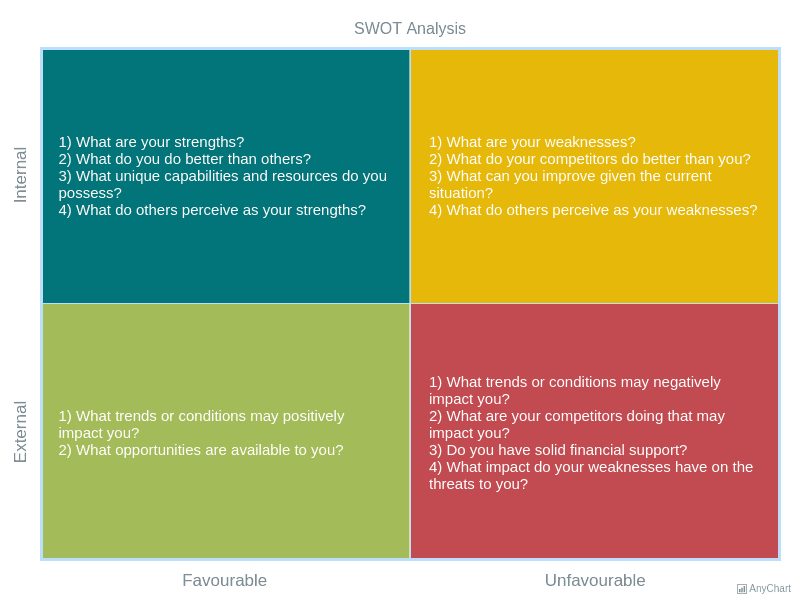
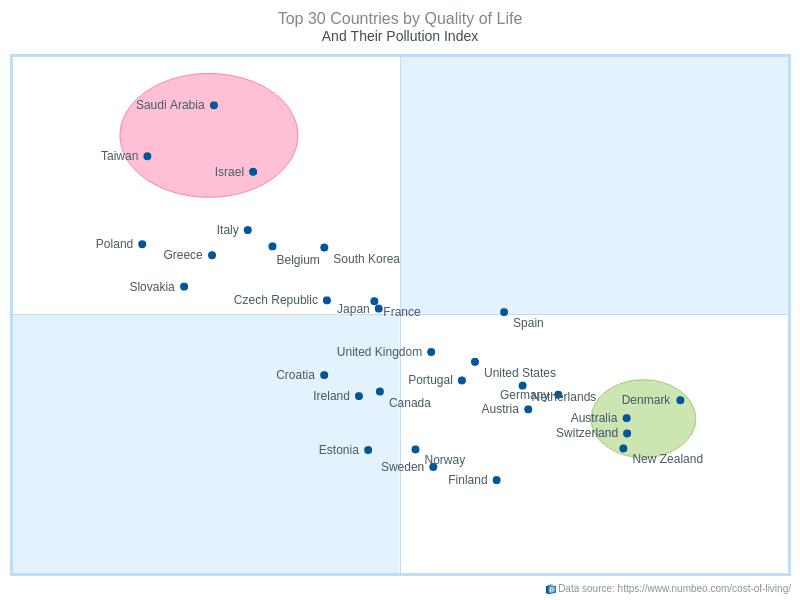
Quadrant charts divide a scatter plot into four labeled zones for classifying data points by two dimensions. Explore BI comparison matrices, Eisenhower priority grids, and animated quadrant motion charts.