We use cookies to ensure that we give you the best experience on our website. If you continue to use this site we will assume that you are happy with it. Read more about our Privacy Policy and Cookie Policy
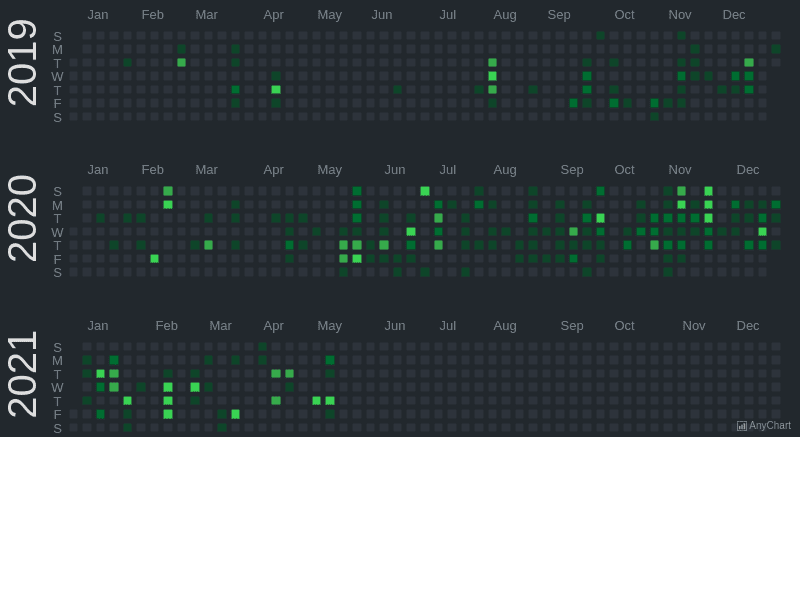
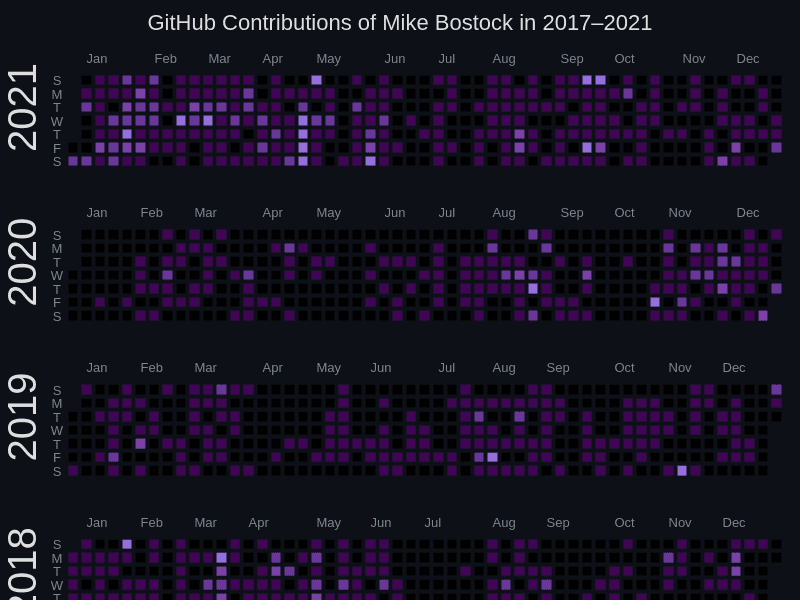
Calendar charts map daily values onto a year grid, where each cell represents a day colored by its value. Explore GitHub-style contribution heatmaps and economic event calendars.
.png)