solution
Sorry, nothing found...
-
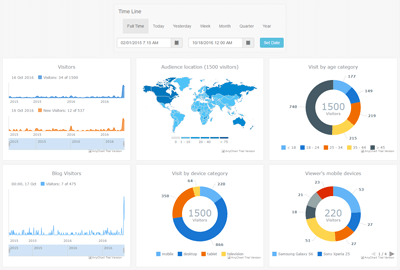
Web-Audience Dashboard
Web-Audience dashboard provides you with a handy snapshot of your page viewers location, favorite device, preferred language, screen resolutions and browsers. The data is presented in an easily digestible manner that allows you to get the gist of your viewers demographic in minutes. -
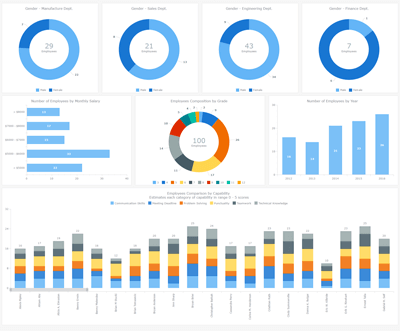
Human Resources Dashboard
Human Resources dashboard provides a large range of employee-related information such as statuses, payrolls, performance etc for HR managers to go over and refer to quickly in the form of graphs and pie charts. -
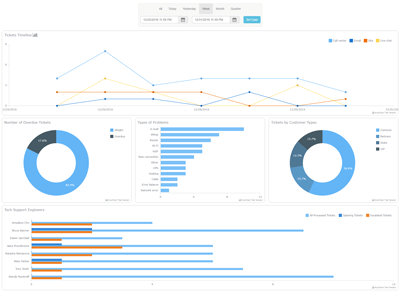
Technical Support Dashboard
The Technical Support Dashboard is designed to help you organize the work of the tech department. Basic indicators such as number of overdue tickets, the type of problems, the statistic of tech support engineers and etc. are presented as simple charts. You won't need to find the information in separate programs, everything is shown in one place. Technical Support Dashboard provides you managing your team effectively. -
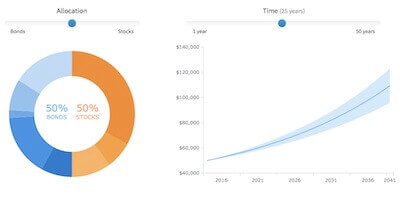
Investment Portfolio Dashboard
Portfolio management is the art and science, which consists of making decisions about investment content combination and policy, matching investments to objectives, asset allocation for individuals and institutions, and balancing risk against performance. This dashboard shows how anyone who is interested in creating solutions for personal portfolio management can use AnyChart Charting solution and illustrate decision making process, as well as performance monitoring, visually appealing and self-explanatory. -
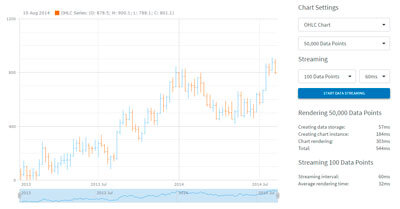
Big Data Speed Test
Our JavaScript charts support rendering thousands of data points in milliseconds. Run a speedtest or try real-time live data streaming. -
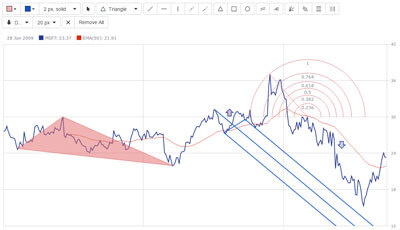
Drawing Tools and Annotations
AnyStock offers a large set of features, that allow you to build your online financial portal and one of the most exciting features is the ability to draw/display on the chart so called drawing tools or, as they are called in our documentation and settings, annotations. -
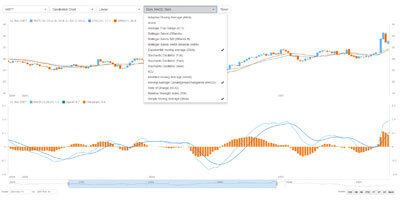
Technical Indicators
Need to analyze your data? Our JS charts include dozens of pre-built technical indicators and you can easily create your own. -
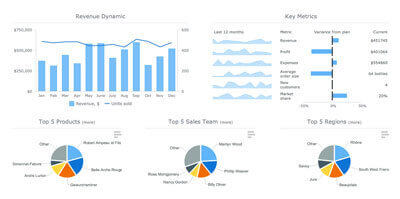
Sales Dashboard
Wine sales in France appear to look amazingly clear and informative when depicted in this interactive HTML5 dashboard through a combination of Bar charts, Pie charts, Column with Line charts, Bullet charts, Sparkline charts, Maps and other ways of data visualization provided by AnyChart JavaScript charts library. This JS sales reporting dashboard looks equally great across all devices and browsers just like all other JS charts and JS dashboards created with AnyChart's solution. -
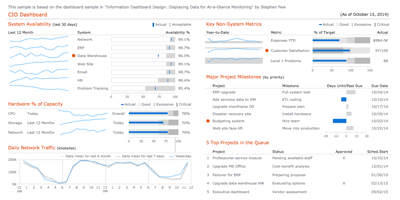
CIO Dashboard
This example of a complex, interactive JavaScript dashboard might be one of the CIO dashboards you have ever seen. That should come as no surprise. First, this HTML5 dashboard is based on a sample from the book "Information Dashboard Design: Displaying Data for At-a-Glance Monitoring" by prominent Stephen Few. Second, it was created fully with AnyChart JS charting library which provides fascinating cross-platform and cross-browser real-time data visualization in HTML5. -
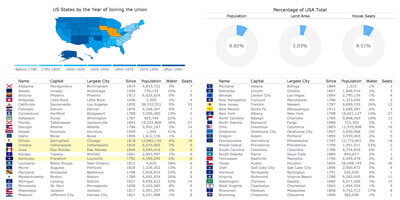
States of United States Dashboard
This HTML5 dashboard greatly depicts data from the article "List of states and territories of the United States" on Wikipedia with the help of the JavaScript charting library of AnyChart. This is another eye-catching example of how JS charts and JS maps provided by AnyChart can be utilized for the statistical data visualization in addition to their perfect suitability for everyone who deals with the creation and use of dashboard, reporting, analytics, financial or any other data visualization solutions through HTML5. -
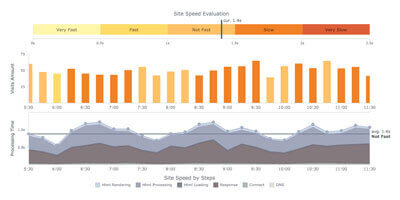
Site Speed Overview Dashboard
This example is made to show the overview of the speed of any website. We have tried to make it a comfortable, visually appealing, and easy to grasp. -

AnyChart Bonfire
This sample is created to show you the power of AnyChart Graphics engine which is a part of AnyChart JavaScript Charts Library and can be used to vizualize virtually anthing. In this case it is a bonfire. A few lines of code and, due to the flexibility of our framework, you see an animated flame on your page: it may seem like a joke, but this goes anywhere: you can use AnyChart to create infographics, customize the smallest parts of your charts or create your own chart types. -
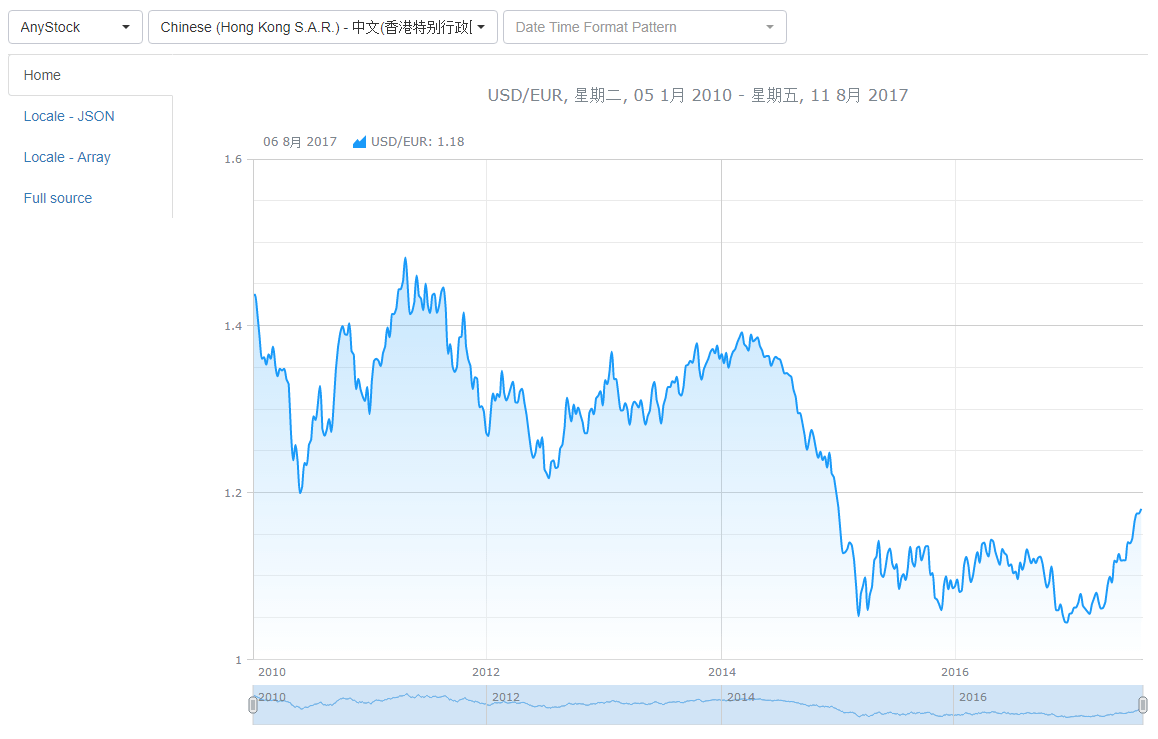
AnyChart Localization and Date-Time Formatting
AnyChart Localization and Date-Time Formatting Utility demonstrates all the functionality necessary for formatting date-time data.
It is an irreplaceable tool for a developer; it provides all the country and language-dependent date-time settings, plus allows choosing preset date-time formatting patterns or creating your own ones - with ease. -
AnyChart Themes Demo
It is easy to adjust look and feel of your charts using themes and palettes - AnyChart includes set of built sets or you can create your own scheme.