We use cookies to ensure that we give you the best experience on our website. If you continue to use this site we will assume that you are happy with it. Read more about our Privacy Policy and Cookie Policy
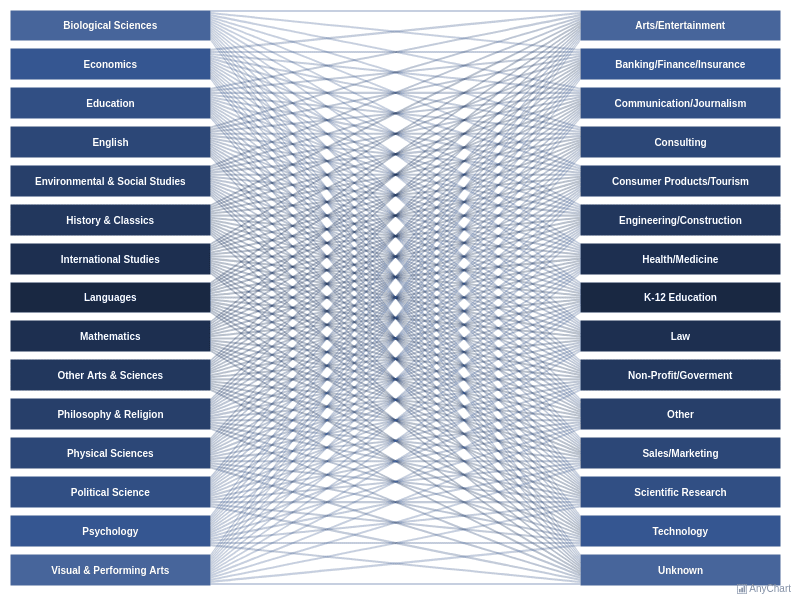
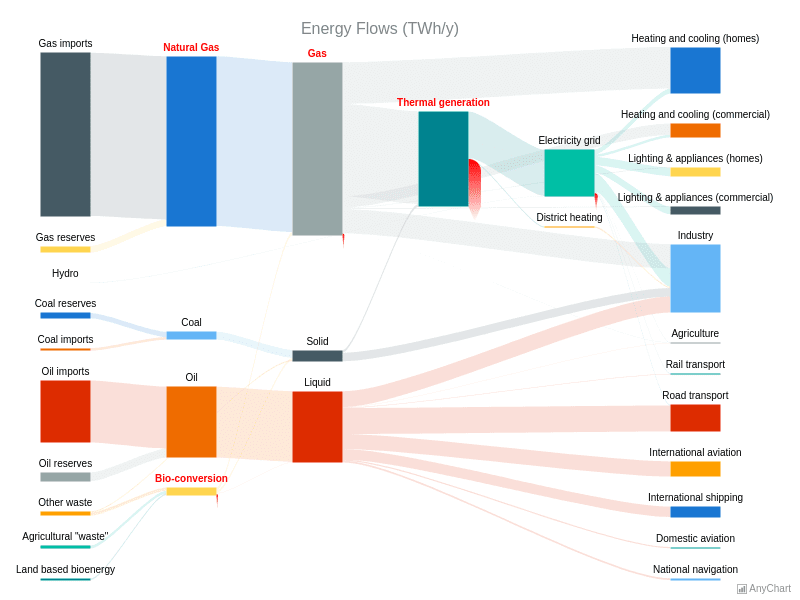
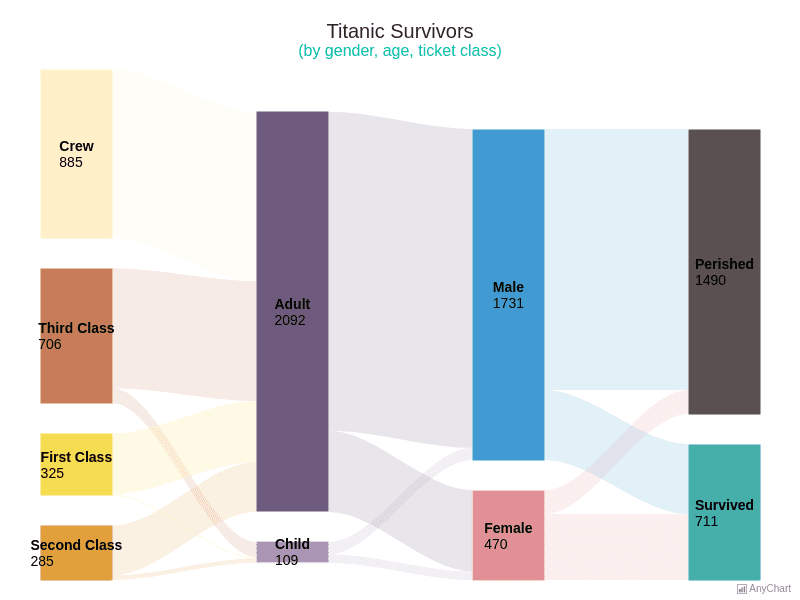
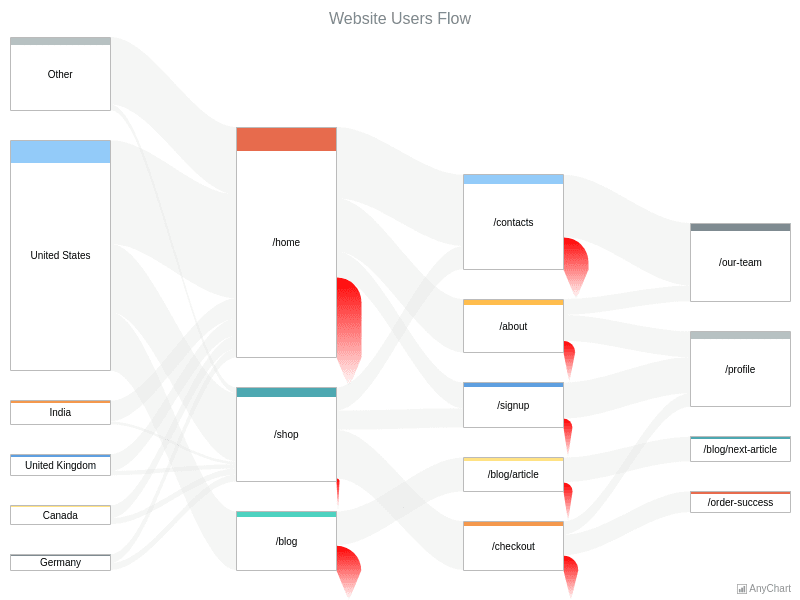
Sankey diagrams visualize flows between nodes, with link widths proportional to quantity. Explore energy balances, budget allocations, user journeys, and multi-step process analysis.