We use cookies to ensure that we give you the best experience on our website. If you continue to use this site we will assume that you are happy with it. Read more about our Privacy Policy and Cookie Policy
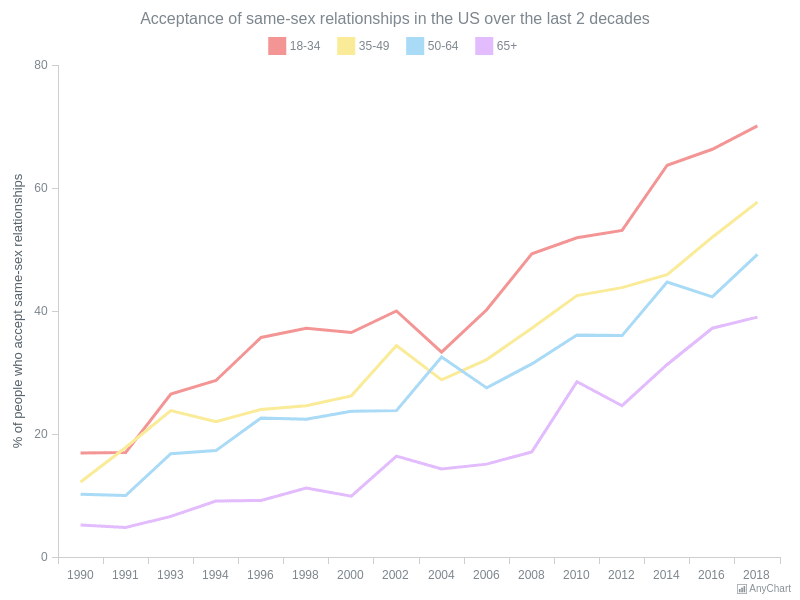
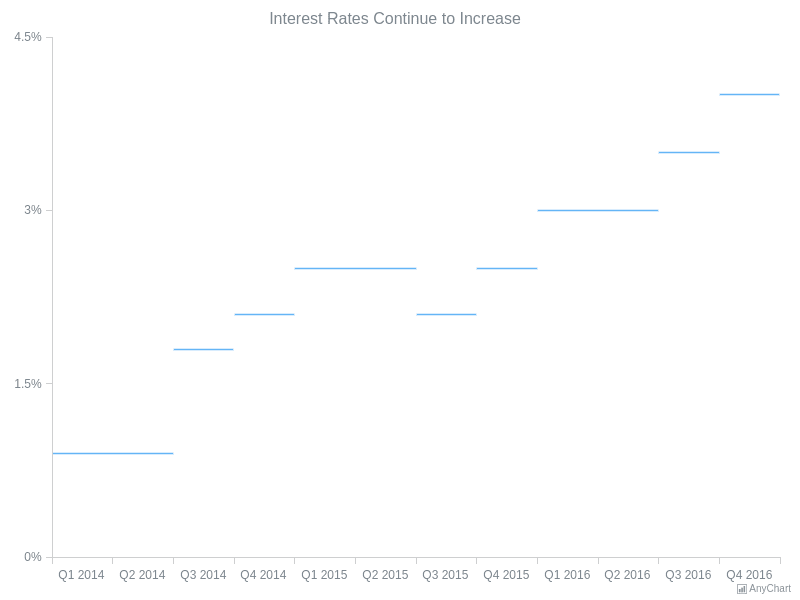
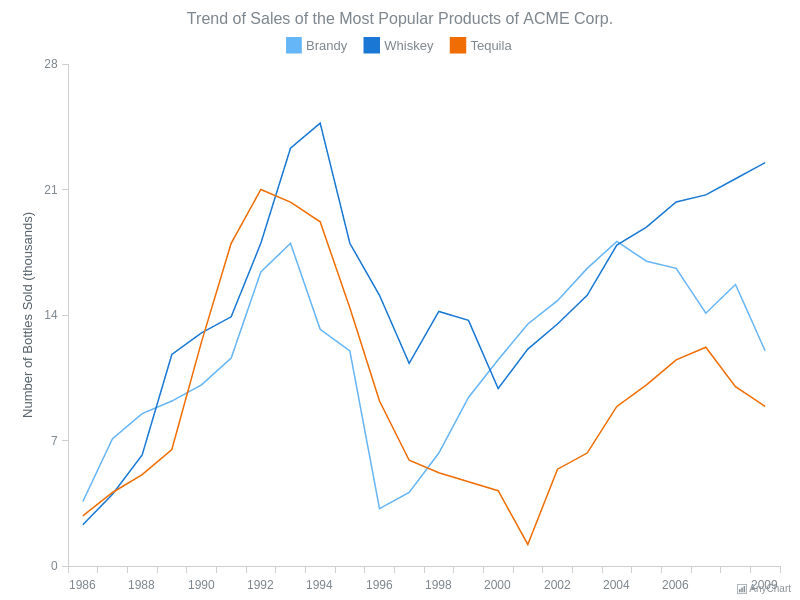
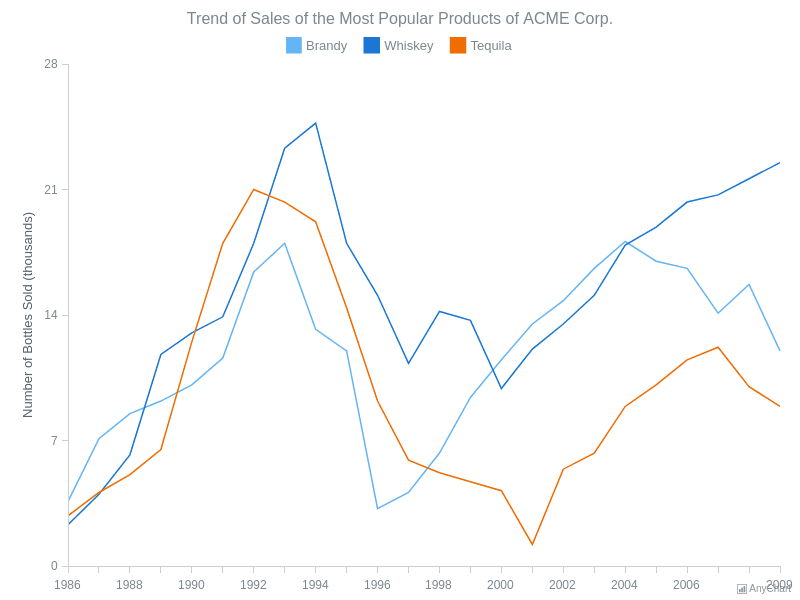
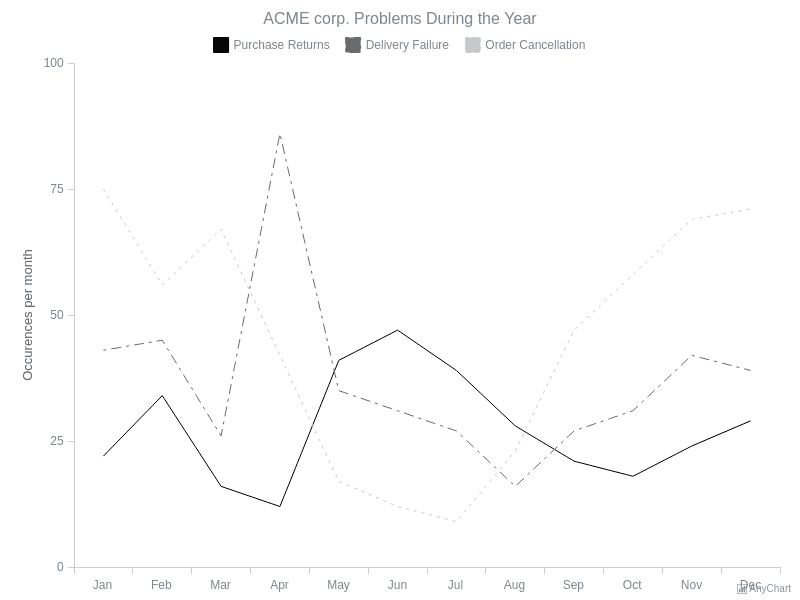
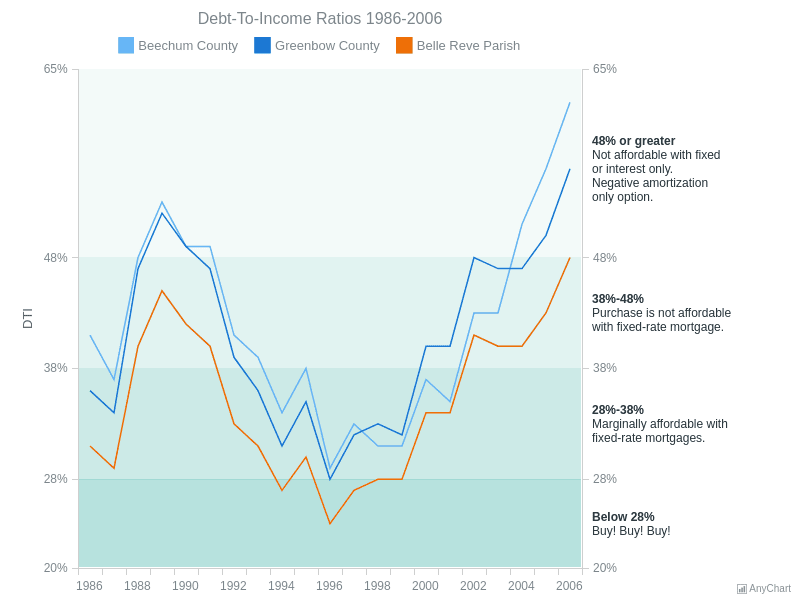
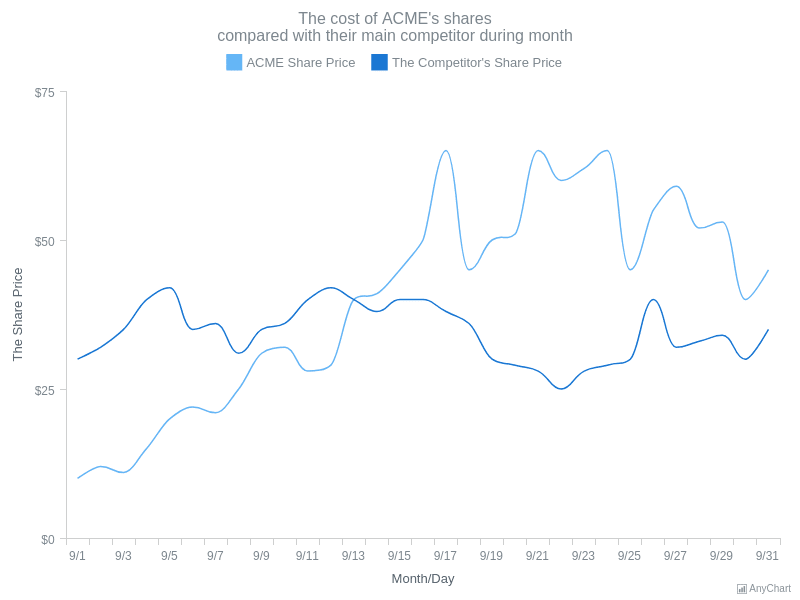
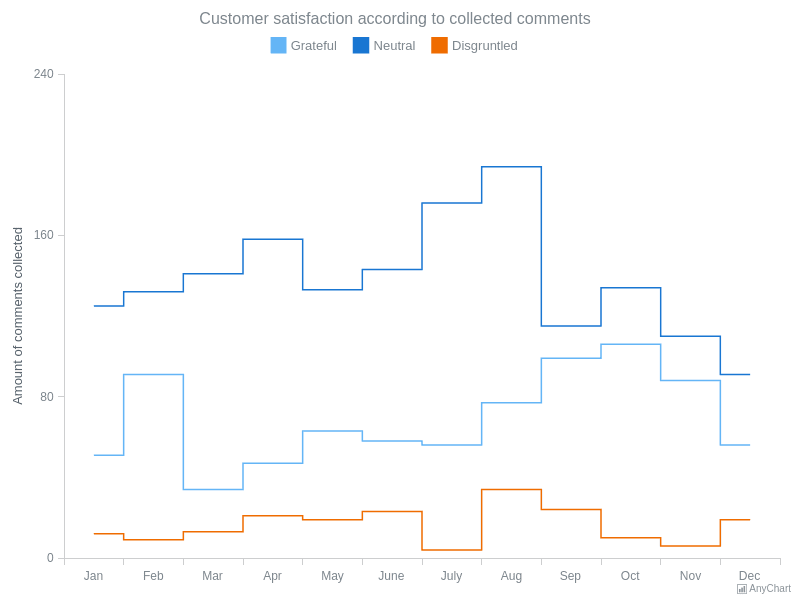
Line charts connect data points with straight or curved segments to show trends over time or categories. Explore single-series, multi-series, logarithmic axes, multiple Y-axes, and custom line markers.

.png)
.png)