Impressive New Data Visuals for Your Inspiration — DataViz Weekly
October 11th, 2024 by AnyChart Team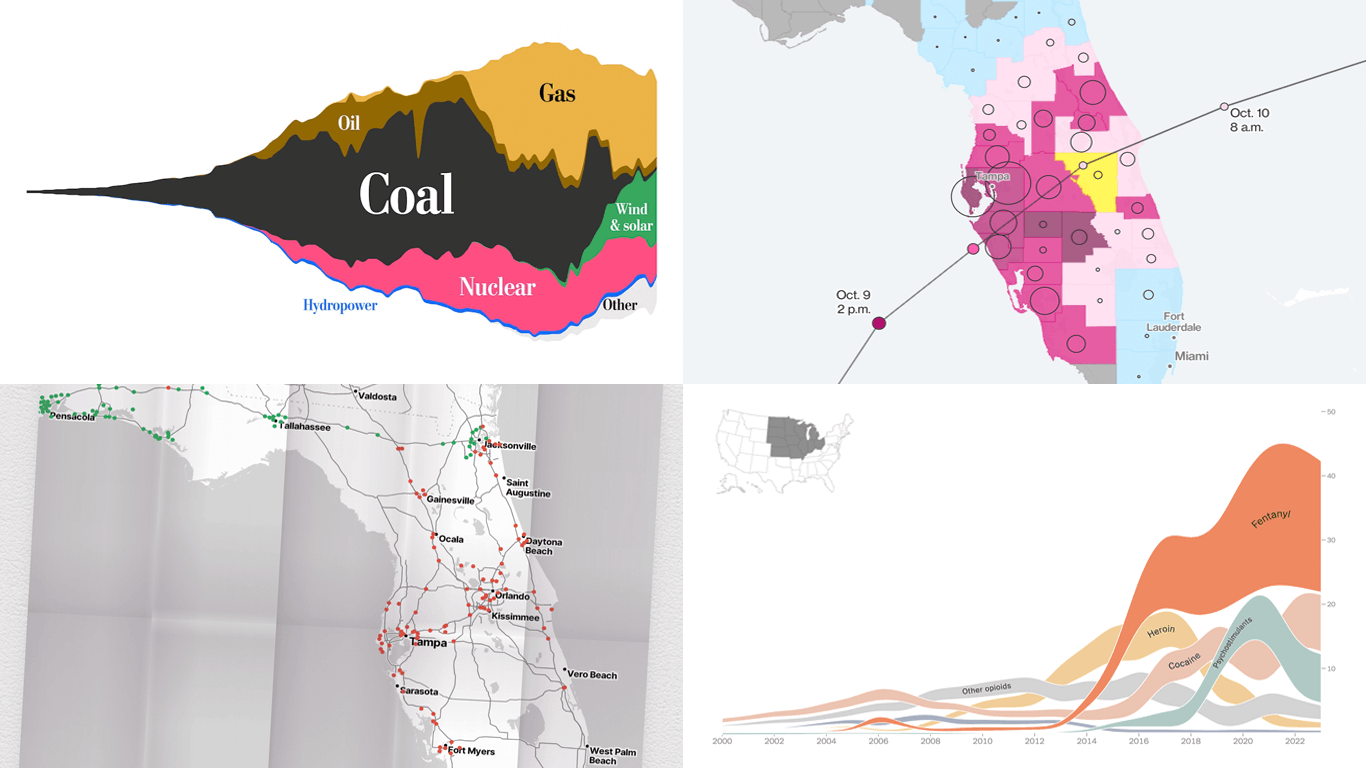 Ready for another dose of impressive data visuals? DataViz Weekly is back with a fresh selection of projects that use powerful graphics to help unravel various trends and patterns. Here are our top picks from what we’ve most recently come across out there:
- End of the UK’s coal power era and lessons for the world — The Washington Post
- Hurricane Milton’s impact and power outages — Bloomberg
- Waffle House Index for Florida under and after Milton — Riley Walz
- Opioid overdose deaths across the United States — NYT Opinion
- Categories: Data Visualization Weekly
- No Comments »
JavaScript Line Chart with Annotations — JS Chart Tips
October 10th, 2024 by AnyChart Team Annotations in charts, such as shapes or text markers, can greatly enhance data narratives by providing more context directly on the visual plane. Thus, it’s no surprise that the ability to add them is one of the most sought-after features of our JavaScript charting library. Although typically used in stock charts, annotations can be just as effective in standard graphics for highlighting specific data points or trends. In this edition of JS Chart Tips, you’ll learn how to add annotations to a basic line chart.
- Categories: AnyChart Charting Component, Charts and Art, HTML5, JavaScript, JS Chart Tips, Tips and Tricks
- No Comments »
Stunning New Charts & Maps from Around Internet — DataViz Weekly
October 4th, 2024 by AnyChart Team Charts and maps have a unique power to let data talk, transforming raw numbers into meaningful insights that anyone can grasp. In this edition of DataViz Weekly, we’re featuring some of the most stunning new examples of how data visualization brings information to life.
- Hazard-prone locations in the United States attracting migration — NYT
- Shifts in college admissions after the affirmative action ruling — Bloomberg
- Google search trends around U.S. elections — Google Trends and Truth & Beauty
- Interactive timeline of Roman history — AnyChart
- Categories: Data Visualization Weekly
- No Comments »
Introducing AnyChart 8.13.0 for Elevated JavaScript Charting Experience
October 3rd, 2024 by AnyChart Team AnyChart 8.13.0 is now available, bringing a set of new features and improvements designed to further elevate your data visualization experience. In this release, we’ve focused on enhancing the Timeline, Waterfall, and Circle Packing charts in our JavaScript charting library, making them even more flexible and user-friendly. Read on to explore what’s new!
- Categories: AnyChart Charting Component, AnyGantt, AnyMap, AnyStock, Big Data, Business Intelligence, Dashboards, Financial Charts, Gantt Chart, HTML5, JavaScript, News, Stock Charts
- No Comments »