Making JS Candlestick Chart in Four Simple Steps
March 25th, 2020 by Anastasia Zoumpliou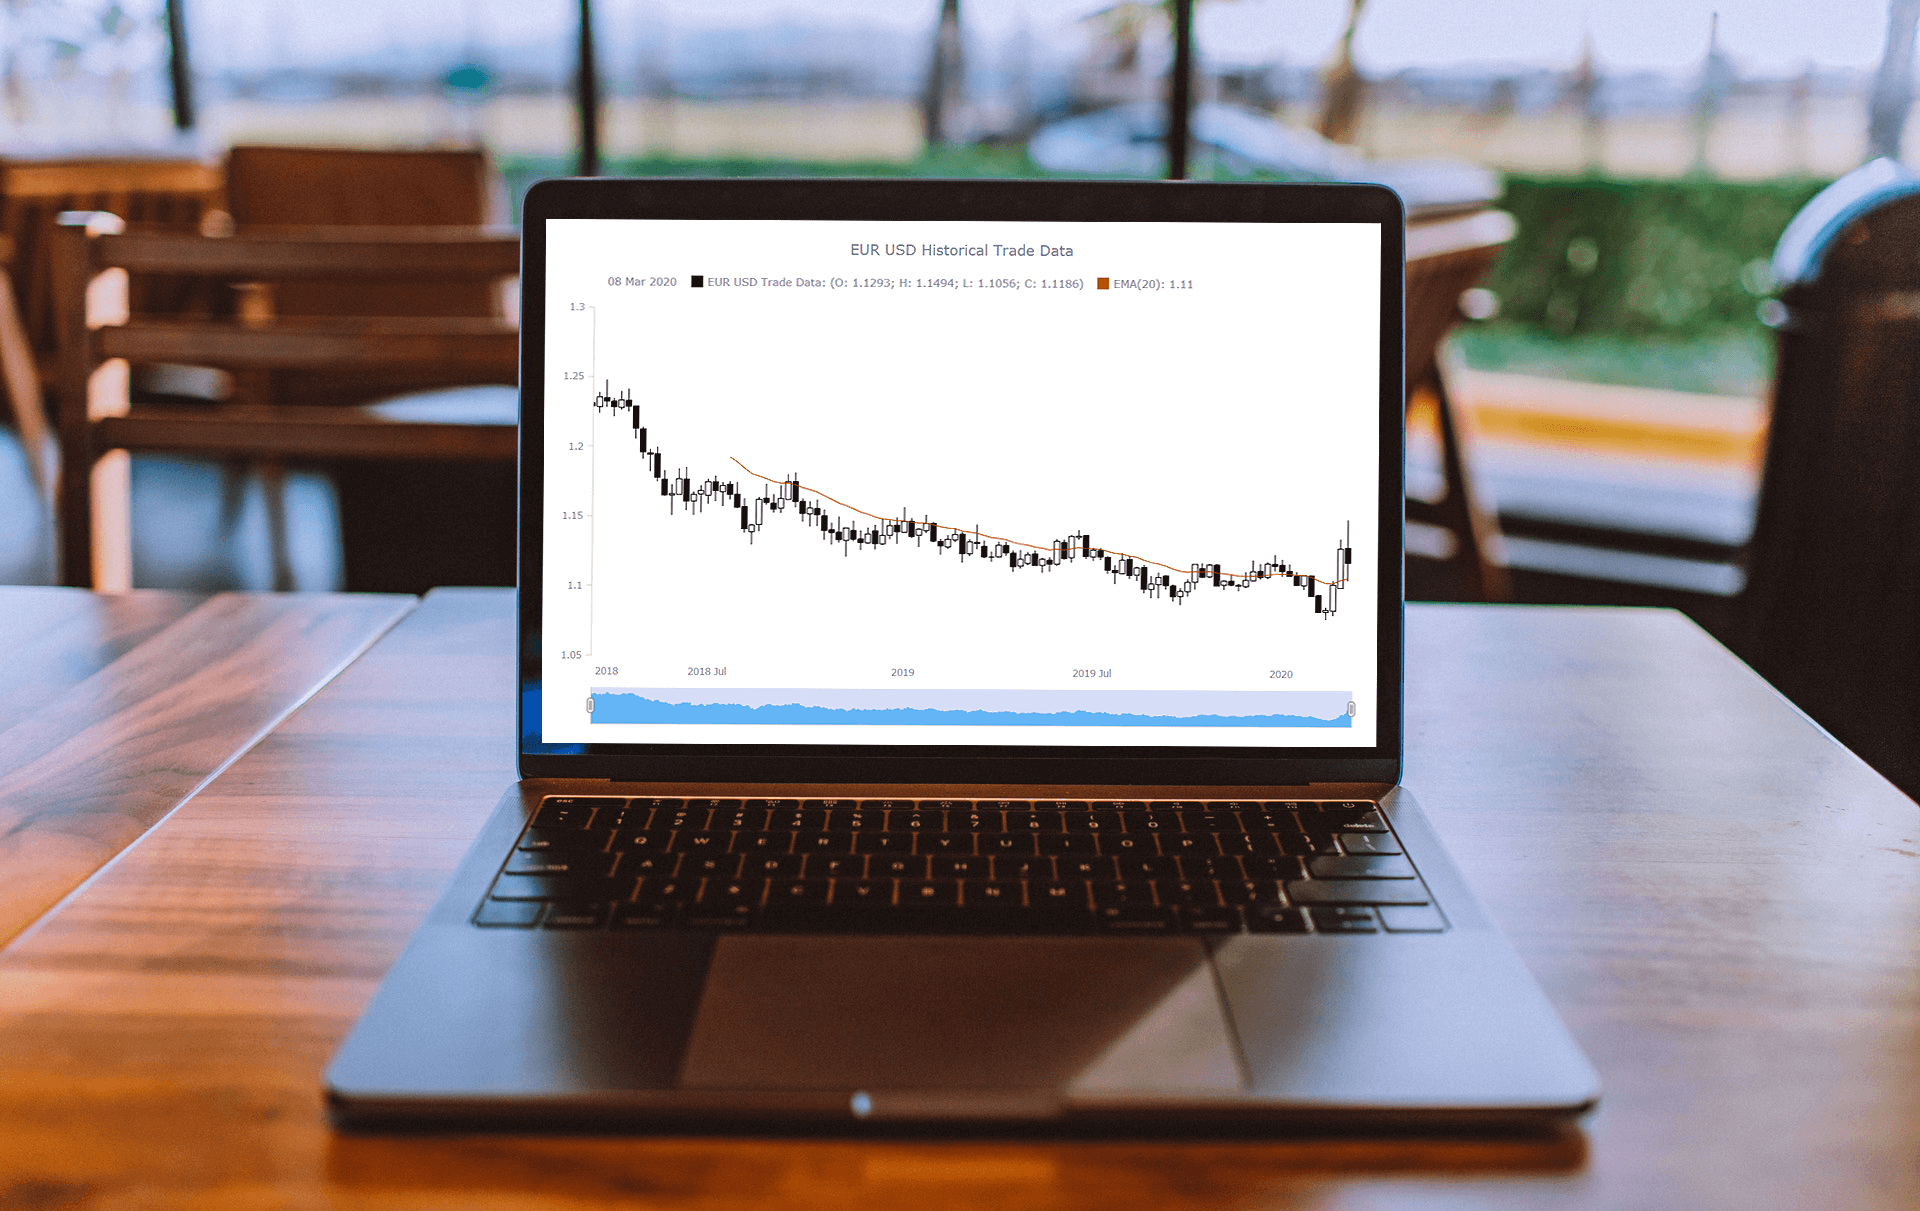 Do you have trading data, looking for a way to effectively visualize it for your website or app project? If so, a JS candlestick chart could be your best pick. This tutorial will break down the process needed to create such a chart into simple steps and provide a detailed explanation of the code. Keep reading even if you are new to programming, because only a basic understanding is needed to follow along and master such a JavaScript (HTML5) based data visualization technique.
Also called a Japanese candlestick chart, this chart type is one of the most popular forms of financial and stock data visualization. Each candlestick represents information about the open, high, low, and close price of the day. Candlestick charts are widely used in technical analysis of price movement patterns.
Complete this tutorial and you will be able to create a compelling interactive candlestick chart in JavaScript real quick, with ease.
Read the JS charting tutorial »
- Categories: AnyChart Charting Component, AnyStock, Big Data, Financial Charts, HTML5, JavaScript, JavaScript Chart Tutorials, Stock Charts, Tips and Tricks
- No Comments »