 We’ve just updated our JavaScript charting library with new exciting features and improvements! In the 8.8.0 release of AnyChart JS, the focus is put on enhancements for Gantt charts. They will be helpful in making your project and resource data visualizations even more insightful with ease. We’ve also upgraded basic and time-series charts as well as maps. Below is an overview of the new key arrivals. Be sure to check it out, download the updated builds, and enjoy!
New JavaScript Charting Library Features
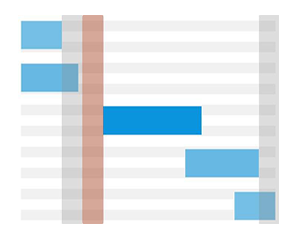 |
Weekends, Holidays and Nonworking Time ColoringProject and Resource Gantt charts now have the option to color holidays, weekends, and nonworking time. Use the anychart.core.ui.Timeline#weekendsFill, anychart.core.ui.Timeline#holidaysFill and anychart.core.ui.Timeline#workingFill methods to set how the weekend, holiday and nonworking time defined by the anychart.core.gantt.Calendar#holidays and anychart.core.gantt.Calendar#schedule methods are shown. |
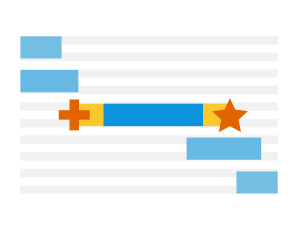 |
Start/End MarkersIn Project Gantt charts, now it is possible to display start and end markers for actual, baseline, and progress bars with the startMarker() and endMarker() methods. |
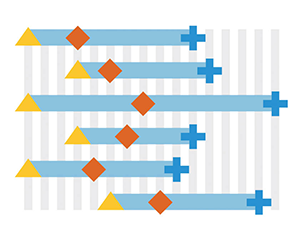 |
Milestones on Resource chartIn Resource Gantt charts, now you can show milestones. It allows you to visualize multiple milestones with individual tooltips in one line. |
 |
Zoom Using Mouse WheelWe’ve also added the option to change how a Gantt chart behaves when the mouse wheel is used: zoom or scroll. Use zoomOnMouseWheel() to change it. |
 |
Text shadow effectFor most of the text elements in all charts (and maps), now you can tune text shadow using the textShadow() method. The shadow effect can be helpful in displaying text on some background colors or give your visualizations more of a wow effect. |
 |
Fiscal Year ShiftThe start of the fiscal year in Gantt charts can now be set to any month of this or next year. This allows you to display the timeline properly in the world of financial or budget years. |
Other Improvements
In addition, a list of improvements we’ve brought to our JS charts library includes the following:
- Background corners settings in basic charts can now be set in percents or pixels.
- Performance of sunburst chart labels is significantly enhanced, and now they can render more than 20,000 points.
- Cambodia’s map already reflects the split of Kampong Cham into two provinces: Kampong Cham (west of the Mekong River) and Tbong Khmum (east of the Mekong River).
Plus, there are other enhancements and bug fixes. Check the version history of the product you are using to keep up with the latest changes:
Share Feedback
How did you like the new major release of our JavaScript charting library? What features and improvements would you like to see there next?
Send us your feedback and we will be glad to adjust the roadmap according to your needs.
Enjoy AnyChart JS Charts 8.8.0!
- Categories: AnyChart charting component, AnyGantt, AnyMap, AnyStock, Big Data, Business Intelligence, Dashboards, Financial charts, Gantt Chart, HTML5, JavaScript, News, Stock charts
- 1 Comment »