CEO Anton Baranchuk Receives 2023 DEVIES Award for AnyChart
February 16th, 2023 by AnyChart Team Last night was amazing: Anton Baranchuk, CEO and Co-founder of AnyChart, received our award for Best in Data Analytics and Visualization at DeveloperWeek’s DEVIES Awards ceremony in Oakland, California!
Check out some photos from the event in this quick story!
- Categories: AnyChart charting component, AnyGantt, AnyMap, AnyStock, Big Data, Business Intelligence, Financial charts, Gantt Chart, GraphicsJS, HTML5, JavaScript, News, Qlik, Stock charts
- No Comments »
AnyChart Named Best in Data Analytics & Visualization 🏆
February 3rd, 2023 by AnyChart Team We’re proud to announce that AnyChart has won a prestigious 2023 DEVIES Award in the Data Analytics & Visualization category! Many thanks to the jury and congratulations to all our partners and customers!
Celebrating 20 years in the market this year, we at AnyChart have been working hard to develop the best-in-class data visualization solutions. And we will keep innovating and excelling!
The DEVIES Awards are the definitive annual awards for the software industry, recognizing outstanding design, engineering, and innovation in developer technology across multiple categories. This year, winners were selected from record-high hundreds of nominations by an expert-led panel of the DevNetwork Advisory Board, including representatives of Accenture, DigitalOcean, EA, Google, IBM, Salesforce, and other great companies.
- Categories: AnyChart charting component, AnyGantt, AnyMap, AnyStock, Big Data, Business Intelligence, Dashboards, Financial charts, Gantt Chart, GraphicsJS, HTML5, JavaScript, News, Oracle Apex, Qlik, Stock charts, Success stories
- 2 Comments »
AnyChart Recognized in Top 10 Business Intelligence and Analytics Companies of 2019
November 19th, 2019 by AnyChart Team We are excited to announce that Analytics Insight, a magazine that covers big data and business intelligence developments, included AnyChart in The 10 Next Generation BI and Analytics Companies of 2019 — “for providing the most advanced solutions and playing a significant role in shaping the future of these disruptive technologies.”
The list has been made public in the just-released November issue of the magazine and is accompanied by the stories about each featured company. With permission of Analytics Insight, today we are republishing the magazine’s story about us on our blog — “AnyChart: Turning Data into Actionable Insights with Award-Winning Data Visualization Solutions.”
Read the story of AnyChart as it appeared on Analytics Insight »
- Categories: AnyChart charting component, AnyGantt, AnyMap, AnyStock, Big Data, Business Intelligence, Charts and Art, Dashboards, Financial charts, Flash platform, Gantt Chart, GraphicsJS, HTML5, Interesting Facts, JavaScript, News, Success stories
- No Comments »
Data Visualization with JavaScript: The Story of AnyChart JS Charts
September 7th, 2017 by AnyChart Team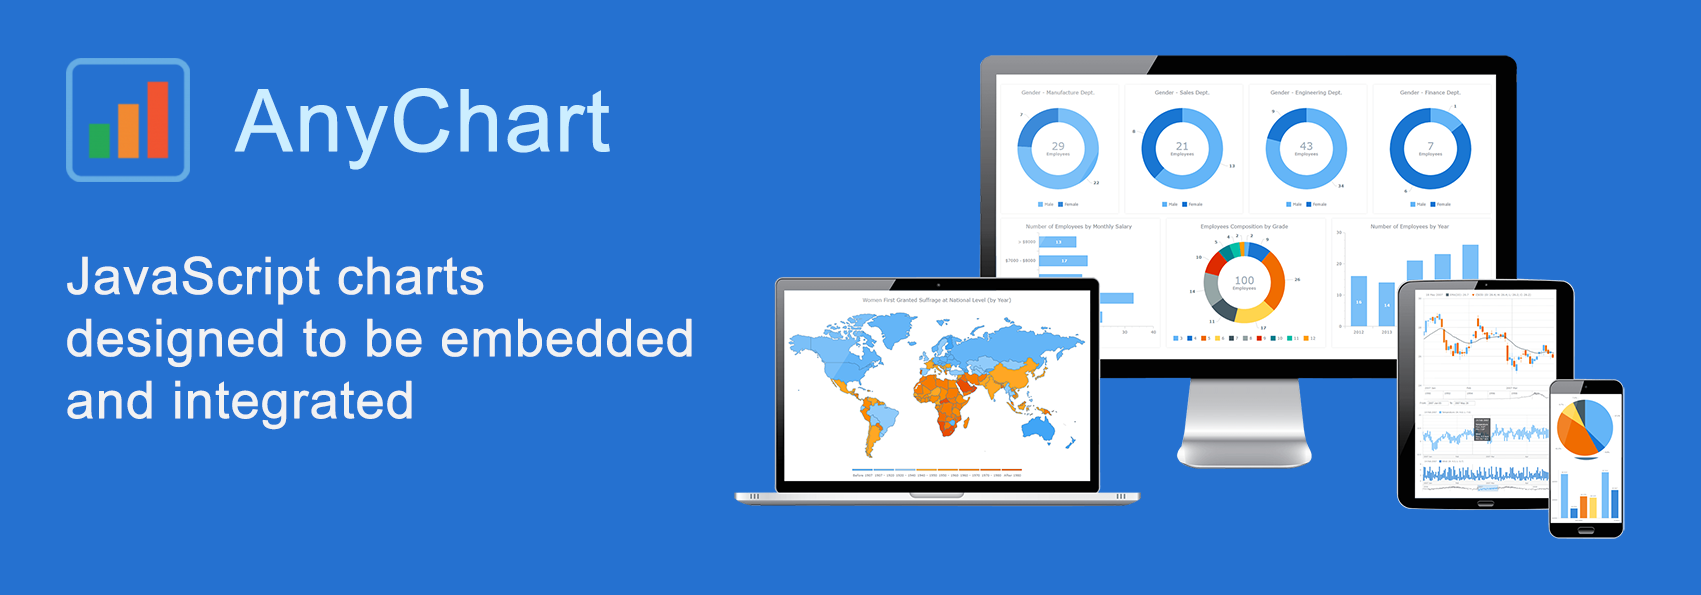 AnyChart is a flexible JavaScript (HTML5) based solution that allows you to create interactive and great looking charts. It is a cross-browser and cross-platform charting solution intended for everybody who deals with creation of dashboard, reporting, analytics, statistical, financial or any other data visualization solutions. AnyChart works everywhere -PCs, Macs, iPhones, iPads, Android devices and helps businesses transform operational data into actionable information.
Kevin William David interviewed Anton Baranchuk, CEO at AnyChart to know more.
- Categories: AnyChart charting component, AnyGantt, AnyMap, AnyStock, Business Intelligence, Flash platform, GraphicsJS, HTML5, JavaScript, Oracle Apex, Qlik, Success stories
- No Comments »
JavaScript Drawing Library GraphicsJS 1.2.0 Released + Introduction from SitePoint
May 3rd, 2017 by AnyChart TeamGraphicsJS, our powerful JavaScript drawing library that we open-sourced last year, has recently got an update to version 1.2.0. It is the next best news of 2017, a great addition to winning a Devies Award with GraphicsJS for the category “JavaScript Technologies” and to the 7.13.0/7.13.1 releases of our JS/HTML5 charting solutions AnyChart, AnyStock, AnyMap, and AnyGantt.
So, we invite you to take a very quick look at the most important updates (we’ll highlight the two below). And then – in case you want to feel the real power of JavaScript drawing and have not used GraphicsJS in your business or fun web projects yet – we are sharing a nice article published on SitePoint just recently. It is an introduction to GraphicsJS based on two tutorials. They will guide you through the most valuable features of this JavaScript drawing library and demonstrate them in action, and you’ll learn how to easily create a naïve art picture and a time-killer game.

JavaScript Drawing with GraphicsJS: Main Improvements
- Closure library and Closure compiler were updated to version 20161024.
- Enjoy an improved JavaScript drawing performance! In particular, we optimized the process of obtaining a link to a container for the stage. Also, resize events are now handled with the help of the Timer object, not the iFrame element.
Now, you are welcome to read the SitePoint article about GraphicsJS. Please do not forget to ask your questions, if any. You may do that by leaving a comment here right below the article.
- Categories: Charts and Art, GraphicsJS, HTML5, JavaScript, News, Tips and tricks
- 2 Comments »
AnyChart Wins 2017 Devies Award for Best JavaScript Technologies (PHOTO)
February 14th, 2017 by AnyChart Team We are proud to tell you today that our company AnyChart has won the JavaScript Technologies category at the 2017 Devies Awards! The ceremony took place yesterday in San Francisco, CA, as part of DeveloperWeek, the world’s largest developer conference and expo with 8,000 attendees. Our CEO Anton Baranchuk received the award on behalf of the AnyChart team.
The DeveloperWeek Advisory Board received hundreds of nominations and, of course, thoroughly studied how much we did last year. What excited the judges most was the public release of our JavaScript graphics library GraphicsJS. And they concluded that to be last year’s most notable innovation in JavaScript technologies, exceptionally meaningful to the whole web development community.
The Devies Awards celebrate the most innovative companies in the field of developer technologies across 13 categories. Together with AnyChart, among this year’s winners are industry giants Microsoft and IBM.
- Categories: Charts and Art, GraphicsJS, JavaScript, News, Success stories
- 5 Comments »
AnyChart JS Charts 2016 Year in Review: Look How Much Was Done!
December 26th, 2016 by AnyChart TeamThis year has been so busy and fruitful for AnyChart JS Charts that now our team is extremely tired and feels incredibly happy at the same time. In fact, we went all out to make our JavaScript (HTML5) based charting libraries AnyChart, AnyStock, AnyGantt, and AnyMap even much more feature-rich, flexible, user-friendly, and faster with only one purpose – to bring you an unprecedented data visualization experience.
Looking back, we are proud of how MUCH was done in 2016! And now, we invite you to join us in quickly reviewing this year’s accomplishments that further strengthened AnyChart’s global leadership in interactive data visualization.
Without more ado, here is the list of new product and feature arrivals as well as major improvements to our JS charts solutions – a great chance to make sure you did not miss any important innovation.

1. More Types of JS Charts.
JS graphs and diagrams
- Treemap charts
- Linear gauges – LED, tank, and thermometer
- 3D area charts
- 3D bar charts
- 3D column charts
Stock and financial JS charts
- Candlestick charts
- Spline charts
- Step line charts
- Area charts
- Step area charts
- Spline area charts
- Marker charts
- Range column charts
- Range area charts
- Range spline area charts
JS Gantt charts
- PERT (Program Evaluation and Review Technique) charts
- Resource charts (redesigned; beta)
JS maps
- Dot (point) maps
- Flow (connector) maps
- Seat maps
2. More Features in JS Charts.
All JS charts
- Full accessibility (Section 508)
- Localization engine with 196 culture-specific locale settings files. Demos: AnyChart, AnyStock, AnyGantt, AnyMap
JS graphs and diagrams
- Chart themes/palettes (demo)
- Exclude/include data points
- Context menu
- Save data as XSLX and CSV
- Save chart configuration as XML and JSON
- String tokens
- Chart statistics
- Standalone chart elements
- Tooltip settings improvement
Stock and financial JS charts
- Drawing tools and annotations (demo)
- Technical indicators – MACD, RSI, SMA, EMA, ROC, Aroon, and custom
- Data grouping
- Markers on data points
- Range selection UI
- Legend interactivity
- Y-scale comparison mode (changes and percentage changes)
JS Gantt charts
- Calendar support
- Smart timeline
- Event markers for time intervals and important events
- Timeline markers for multiple milestones
JS maps
- Drill down
- Longitude/latitude API
- Move/zoom API
- Rich integration of keyboard and mouse controls
- 13 map projections
3. Easier JS charting.
- Chart editor (demo)
- Demos of business solutions including the following JavaScript (HTML5) dashboards:
- Web Audience dashboard
- Human Resources dashboard
- Investment Portfolio dashboard
- Sales dashboard
- CIO dashboard
- Site Speed Overview dashboard
- States of the US dashboard
- Migration tool – a small library for easier transit from AnyChart 5/6 to 7
- 20+ technical integration templates and samples for easy JS/HTML5 data visualization with any popular technology stack:
- ASP.NET – C# / C#, SignalR / VB.NET – MySQL integration template
- Clojure – ClojureScript – PostgreSQL integration template
- Go – (Revel) – MySQL integration template
- iOS – Objective-C – SQLite integration template
- Java Servlets – Maven, JDBC, JSP – MySQL integration template
- Java Spring – Maven, Hibernate – MySQL integration template
- Julia – MySQL integration template
- NodeJS – (Express, Jade) / Socket.IO – MongoDB integration template
- Perl – Catalyst – MySQL integration template
- PHP – (Laravel / Slim / Symfony) – MySQL integration template
- Python – Flask / Django – MySQL integration template
- R – Shiny – MySQL integration template
- Ruby on Rails – (Sinatra) – MySQL integration template
- Scala – Akka / Play – MySQL integration template
- Electron integration template
4. Faster JS Charts.
- Performance improvement (speed test):
- Less than 1s to render 250,000 data points
- Less than 60ms to stream 500 points
- Async rendering (docs)
5. New Products.
- AnyChart 7.x Plugins for Oracle APEX
- GraphicsJS, a powerful open-source JavaScript graphics library (SVG)
To sum up, 2016 was immensely intensive. But 2017 will be no less productive from the very beginning – we promise.
We wish you a peaceful, prosperous, and happy new year!
- Categories: AnyChart charting component, AnyGantt, AnyMap, AnyStock, Business Intelligence, Dashboards, Financial charts, Gantt Chart, GraphicsJS, HTML5, JavaScript, News, Oracle Apex, Stock charts
- 2 Comments »
AnyChart Open-Sources Powerful, Draw-Anything JS Graphics Library GraphicsJS
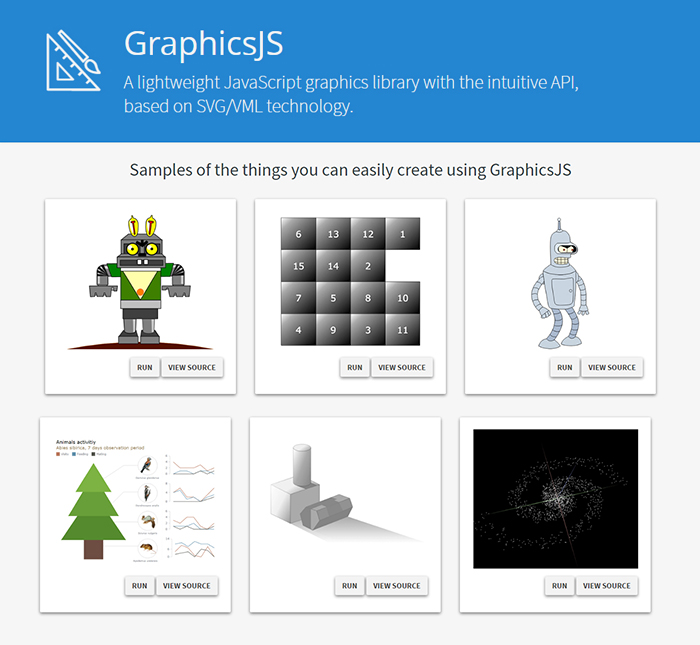
September 15th, 2016 by AnyChart TeamIt is a pleasure for us to announce this today! We have just launched GraphicsJS, a free, open-source, lightweight JavaScript library which allows you to draw any JS graphics and animation for your HTML5 projects very easily. It is significantly more powerful and feature-rich than Raphaël, BonsaiJS, and other formerly leading SVG/VML graphics solutions.
GraphicsJS has always been the graphics engine that our JavaScript (HTML5) charting libraries are built on – AnyChart, AnyStock, AnyGantt, and AnyMap. As a result, it already powers data visualization activities for many of you – Oracle, Microsoft, Volkswagen, AT&T, Samsung, BP, Bosch, Merck, Reuters, Bank of China, Lockheed Martin, and thousands of all the other highly respected AnyChart’s customers including more than 70% of Fortune 1000 companies.
Of course, data visualization is not the only but just one of multiple fields where the library of GraphicsJS can be helpful and even essential. Generally speaking, this solution can help you produce virtually anything graphical from scratch: static and animated images, cartoons, games, interactive infographics, mind maps, and many other amazing things in HTML5.
Key Features of JS Graphics Library
- Mighty line drawing abilities – Bézier curves, arcs, rectangles, and many other kinds of forms and deformations.
- Powerful text manipulation features – multiline texts, measurement, including width, height, as well as wrap, overflow, indent, spacing, align, etc.
- Virtual DOM for drawing fast and only what is necessary.
- Smart layering system with z-index.
- Transformation engine – embarrassing in-browser transformations are not used.
- Legacy browser support (Internet Explorer 6+).
- Concise and convenient JavaScript API with chaining support.
By the way, making our graphics engine open-source is just the beginning as – we are also pleased to tell you – AnyChart is going to open the source code of our charting libraries soon! We believe that our great developments in the fields of graphics and data visualization should be even more visible and reachable to any programmer from any part of the world, not to mention that we would love to allow the community to contribute.
Please refer to GraphicsJS.org to learn more about GraphicsJS. As always, the demos are available on our Playground (Graphics section). Also, let’s not forget about the Graphics Documentation and Graphics API Reference.
What’s more, the GraphicsJS library and all relevant samples can be freely downloaded and forked on GitHub.
- Categories: AnyChart charting component, AnyGantt, AnyMap, AnyStock, Charts and Art, Dashboards, Financial charts, Gantt Chart, GraphicsJS, GraphJam, HTML5, JavaScript, News, Stock charts, Third-party developers, Tips and tricks, Uncategorized
- 5 Comments »
