AnyChart Named Best in Data Analytics & Visualization 🏆
February 3rd, 2023 by AnyChart Team We’re proud to announce that AnyChart has won a prestigious 2023 DEVIES Award in the Data Analytics & Visualization category! Many thanks to the jury and congratulations to all our partners and customers!
Celebrating 20 years in the market this year, we at AnyChart have been working hard to develop the best-in-class data visualization solutions. And we will keep innovating and excelling!
The DEVIES Awards are the definitive annual awards for the software industry, recognizing outstanding design, engineering, and innovation in developer technology across multiple categories. This year, winners were selected from record-high hundreds of nominations by an expert-led panel of the DevNetwork Advisory Board, including representatives of Accenture, DigitalOcean, EA, Google, IBM, Salesforce, and other great companies.
- Categories: AnyChart charting component, AnyGantt, AnyMap, AnyStock, Big Data, Business Intelligence, Dashboards, Financial charts, Gantt Chart, GraphicsJS, HTML5, JavaScript, News, Oracle Apex, Qlik, Stock charts, Success stories
- 2 Comments »
New Progress Tracking Features for Gantt Charts in Qlik Sense
January 24th, 2023 by AnyChart Team![]() Tracking project progress using Gantt charts in Qlik Sense has become even easier with the latest update of our dedicated extension! Learn about the just-released features and improvements. Then update to the newest version of AnyGantt for Qlik and check them out in action!
Tracking project progress using Gantt charts in Qlik Sense has become even easier with the latest update of our dedicated extension! Learn about the just-released features and improvements. Then update to the newest version of AnyGantt for Qlik and check them out in action!
Read more at qlik.anychart.com »
- Categories: AnyChart charting component, AnyGantt, Big Data, Business Intelligence, Dashboards, Gantt Chart, News, Qlik
- No Comments »
AnyChart JS Charts 8.11.0 Released with Awesome New Data Visualization Features
December 7th, 2021 by AnyChart Team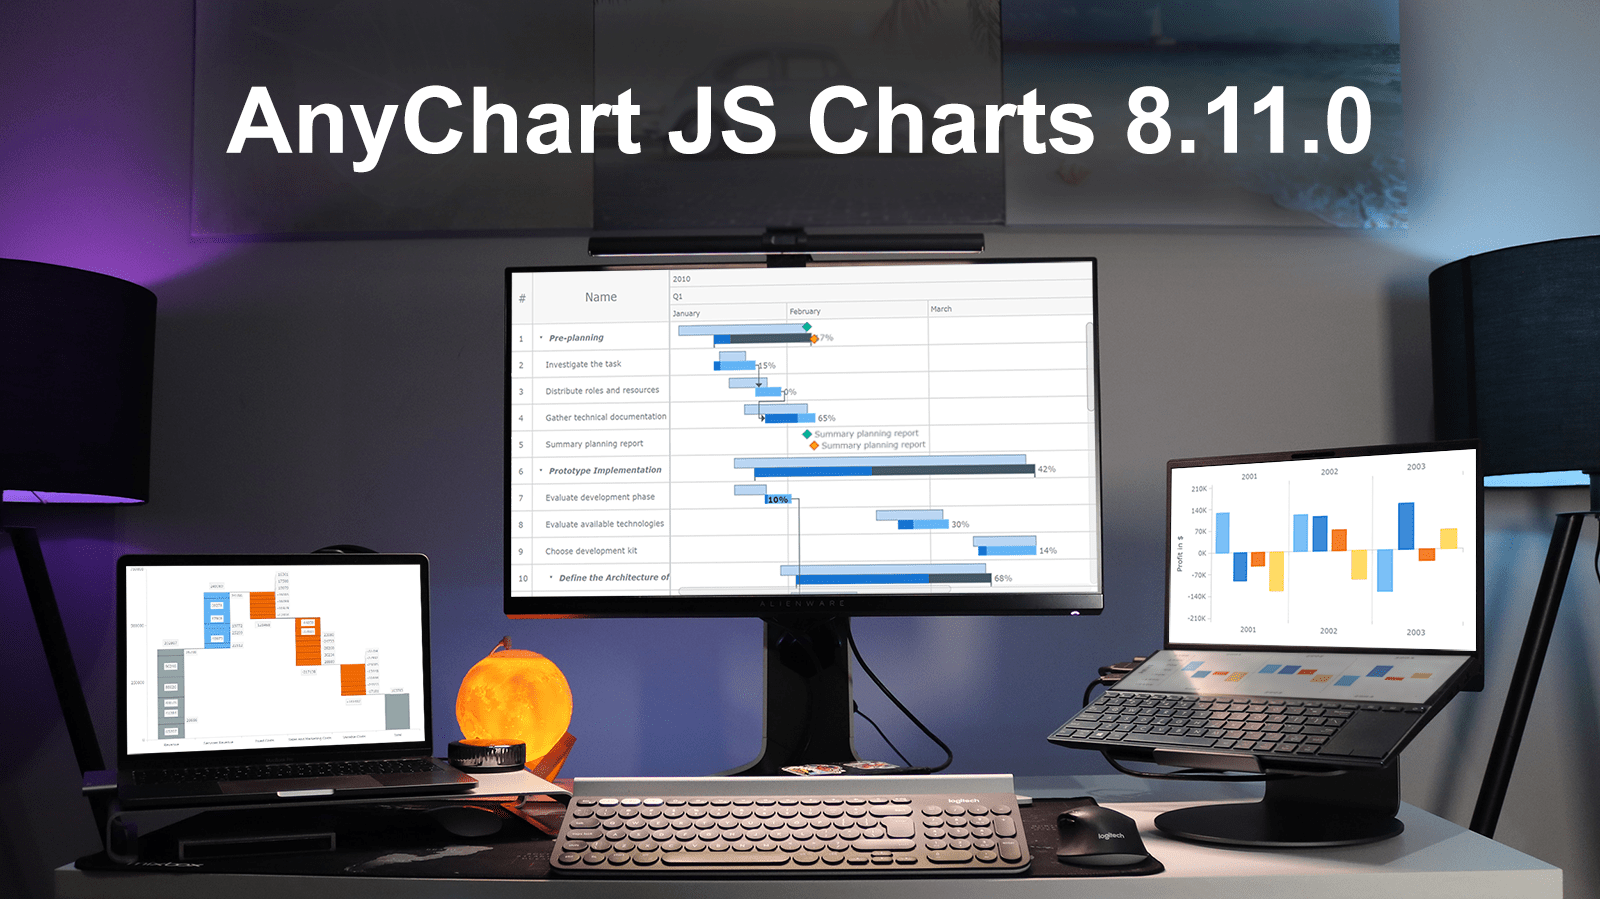 Excited to tell you we’ve just pushed a major update to our JavaScript charting library! The newly arrived features and improvements make our core solution even more flexible, adding awesome fresh capabilities designed to further help you on your data visualization development journey. Intrigued? Let us show what’s new in AnyChart JS Charts 8.11.0 right away!
»»» See What’s New in AnyChart 8.11.0! «««
- Categories: AnyChart charting component, AnyGantt, Gantt Chart, HTML5, JavaScript, News
- 3 Comments »
Building JS Resource Gantt Chart to Visualize Tokyo 2020 Paralympic Schedule
August 17th, 2021 by Shachee Swadia Smart resource allocation is a must to achieve a high level of operational efficiency. Aiming to ensure it, project management professionals commonly rely on a special form of data visualization called a Resource Gantt chart. Creating graphics like this may seem daunting at first sight. But I am here to show you an easy way to build Resource Gantt charts with JS using a compelling, topical example.
Resource Gantt charts, also known as simply Resource charts, consist of bars oriented along the horizontal axis. Each bar visualizes a resource used by an activity, with the length representing the duration while that resource is occupied by that activity. The left and right edges of the bars display the start and end times. The resources, or event labels, are listed on the left. The dates and times are shown in the header.
Tokyo 2020 Paralympic Games are just around the corner. So, I decided to visualize their sports program by venue. Follow along with this stepwise tutorial and you will learn how to create a cool JavaScript Resource Gantt chart visualizing the Tokyo 2020 Paralympic schedule!
Read the JS charting tutorial »
- Categories: AnyChart charting component, AnyGantt, Big Data, Business Intelligence, Gantt Chart, HTML5, JavaScript, JavaScript chart tutorials, Tips and tricks
- No Comments »
Stacked Waterfall Chart for Qlik Sense Upgraded
July 23rd, 2021 by AnyChart Team
You asked, and we listened. We have continued to work on plans to deliver an unprecedented experience with Waterfall Charts in Qlik Sense. And we are pleased to announce that several new valuable features are now there to improve the way you explore not only a by-category but also a by-subcategory breakdown of metrics!
Read below to see what’s new in our Stacked Waterfall Chart for Qlik Sense — just upgraded with the July release of the AnyChart Qlik Extension — and give it a try without delay!
Read more at qlik.anychart.com »
- Categories: AnyChart charting component, AnyGantt, Big Data, Business Intelligence, Gantt Chart, News, Qlik
- No Comments »
Bullseye Chart and Gantt Chart Improvements in Qlik Sense Extensions by AnyChart
March 8th, 2021 by AnyChart Team
🎯 Bam! Meet Bullseye charts in Qlik Sense! Qlik counted on us to provide its customers with “additional choices for building even more compelling visualizations.” And we could not stop innovating, so Bullseye has become the 42nd chart type in AnyChart’s extensions for Qlik Sense — enjoy and hit the bull’s-eye in data-driven decision making!
Also, we have added new awesome features to our Gantt charts in Qlik Sense to help expedite actionable insights into your project data. Learn more about the highlights of the March 2021 release of the AnyChart and AnyGantt extensions in a quick overview, and download the latest version!
Read more at qlik.anychart.com »
- Categories: AnyChart charting component, AnyGantt, Big Data, Business Intelligence, Gantt Chart, News, Qlik
- No Comments »
New JavaScript Chart Features in AnyChart 8.9.0
September 29th, 2020 by AnyChart Team AnyChart 8.9.0 is out! The latest major update brings new exciting out-of-the-box features to our award-winning JavaScript charting library product family — AnyChart, AnyStock, AnyGantt, and AnyMap. Enjoy the improved functionality and build even more compelling data visualizations for your web sites and apps in less time!
»»» See What’s New in AnyChart 8.9.0! «««
- Categories: AnyChart charting component, AnyGantt, AnyMap, AnyStock, Big Data, Business Intelligence, Dashboards, Financial charts, Gantt Chart, HTML5, JavaScript, News, Stock charts
- 2 Comments »
Meet September 2020 Releases of AnyChart and AnyGantt Extensions for Qlik
September 16th, 2020 by AnyChart Team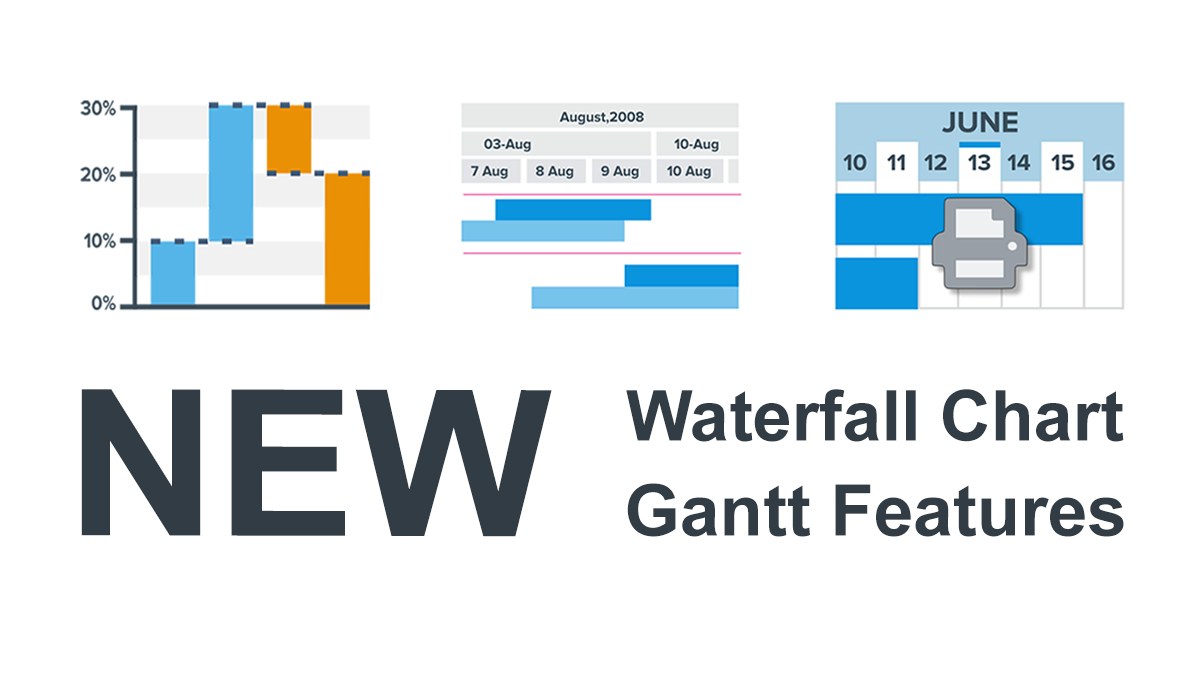 We’ve just updated the AnyChart and AnyGantt extensions for Qlik Sense to further facilitate the path to enhanced data-driven insights for you! Keep reading to learn about the new amazing Waterfall Chart and Gantt Chart features delivered in the 4.3.249 releases. Then check out the latest versions to see them all in action!
Read more at qlik.anychart.com »
- Categories: AnyChart charting component, AnyGantt, Big Data, Business Intelligence, Gantt Chart, News, Qlik
- No Comments »
Connecting MySQL Database to JS Chart Using PHP
August 4th, 2020 by Wayde Herman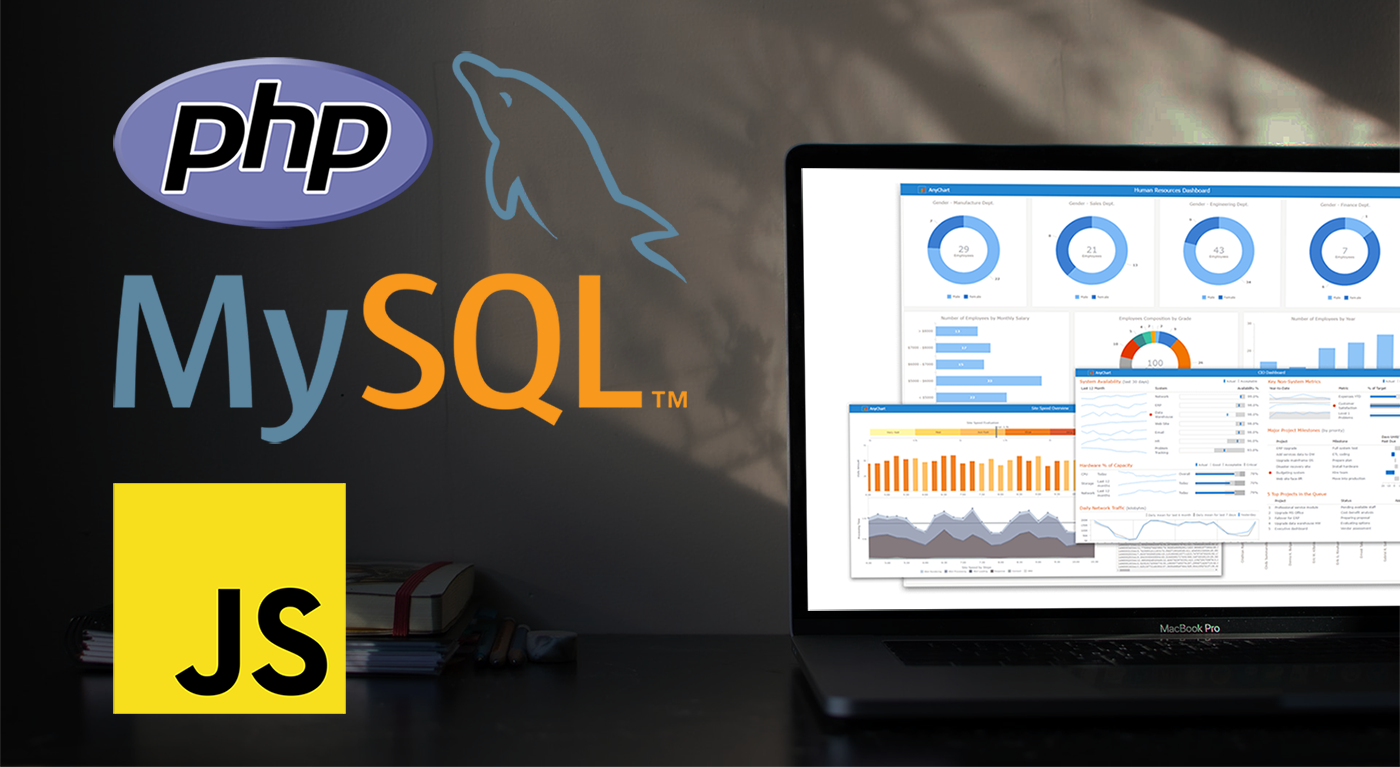 When using a charting library like AnyChart, which makes visualizing data so quick and easy, often the most challenging step for beginners is loading data. I think this is largely a result of the fact that while the ways we output the data are quite similar, the input data is commonly very different. The data may differ in many ways including the number of features in the dataset, what type these features may be, the format of the data, and how the data is stored. It is this final issue which we will be addressing today.
There is a lot of coverage in the documentation of using a data object declared within the code as well as importing your data from a file using AnyChart’s data loader. But what about importing the data from an SQL database? This is an easily done but often misunderstood approach to handling and loading data for data visualizations.
Unfortunately, it is not possible to use JavaScript to query a database because JavaScript is a client side solution and querying a database requires a server side approach due to security concerns — you just can’t store database login and password in your JavaScript code. There are many workarounds for this problem including approaches involving PHP, Ajax, Node.js, and many more. Today we will focus on using PHP to handle this task for us when our data is stored in MySQL.
In this tutorial, we will be covering how to query a MySQL database using PHP. We will describe the steps involved and reveal that it is in fact not challenging at all, just different!
- Categories: AnyChart charting component, AnyGantt, AnyMap, AnyStock, HTML5, JavaScript, JavaScript chart tutorials, Tips and tricks
- 2 Comments »
Qlik Sense Visualization Extensions AnyChart, AnyStock and AnyGantt Updated with New Features
July 16th, 2020 by AnyChart Team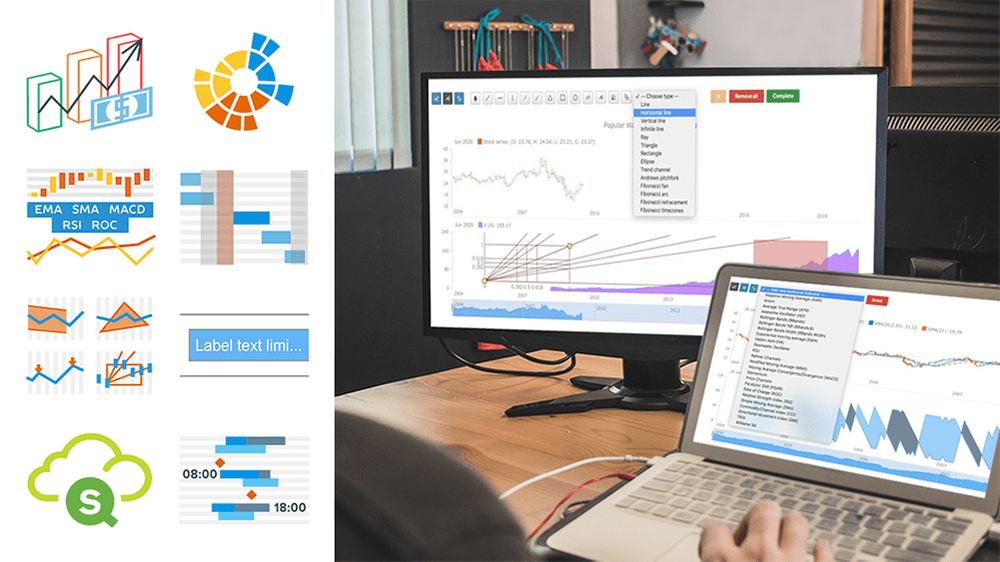 A number of new powerful capabilities are now available in our extensions for Qlik Sense! The new features are designed to help speed up data analysis in the native Qlik environment, making it even more intuitive and workflows streamlined.
Read more at qlik.anychart.com »
- Categories: AnyChart charting component, AnyGantt, AnyStock, Big Data, Business Intelligence, Financial charts, Gantt Chart, News, Qlik, Stock charts
- No Comments »