AnyChart JS Charting Library 7.12.0 Released
October 31st, 2016 by Margaret SkomorokhAnyChart JS charting library updated! We are glad to announce four new releases: AnyChart, AnyStock, AnyMap, and AnyGantt 7.12.0 are now available for download.
AnyChart 7.12.0 New Features
 |
Localization Support One of the main news of this release: support of localization using locale settings files and special formatting functions. Now our JS charting library allows to switch between 196 different regional settings, and all date/time chart elements update themselves. Take a look at AnyChart Localization demo>> Learn more about Localization Support>> |
 |
Standalone Chart Elements Now you can use all chart building blocks, such as scales, axes, legends and so on to build your own charts and dashboards. Use this feature along with AnyChart’s GraphicsJS graphics library, and you will be able to create your own unique charts and visualizations. Learn more about Standalone Chart Elements>> |
 |
Tooltip Settings Improvement API for tuning chart and series tooltips is improved. These changes allow to make your applications simpler, leaving room for flexibility as well. Learn more about Tooltip Settings Improvement>> |
AnyStock 7.12.0 New Features
 |
Localization Support One of the main news of this release: support of localization using locale settings files and special formatting functions. Now our JS charting library allows to switch between 196 different regional settings, and all date/time chart elements update themselves. Take a look at AnyStock Localization demo>> Learn more about Localization Support>> |
 |
Range Selection UI Controlling data grouping and time interval is paramount when it comes to financial data and stock charts. We are happy to present a set of UI elements that help you to add range selection functionality to your applications. Take a look at Range Selection UI in the Gallery>> Learn more about Range Selection UI>> |
AnyMap 7.12.0 New Features
 |
Localization Support One of the main news of this release: support of localization using locale settings files and special formatting functions. Now our JS charting library allows to switch between 196 different regional settings, and all date/time chart elements update themselves. Take a look at AnyMap Localization demo>> Learn more about Localization Support>> |
 |
Map Grid (Meridians and Parallels) Showing meridians and parallels on a map greatly improves its design and provides a clear view in visualizations where latitude and longitude do matter. Map Grid (Meridians and Parallels) in the Gallery>> Learn more about Map Grid>> |
 |
Map Axes Map axes with latitude and longitude labels complement map grid showing meridians and parallels on a map. Geo Scale that controls Map Axes and grid allows to fine-tune the display and achieve a great variety of looks and feels for map visualizations. Learn more about Map Axes>> |
 |
Map Crosshair Map Crosshair is a visual position tracking element, especially useful in exploratory data analysis visualizations. It works nicely in conjunction with Map Grid and Map Axes. Take a look at Map Crosshair in the Gallery>> Learn more about Map Crosshair>> |
AnyGantt 7.12.0 New Features
 |
Brand New Resource Chart (Beta) We are doing our best to improve our products and this time we decided to take a fresh look at Gantt and Resource charts. We have studied how people manage projects and company resources, what they want to see, how they want to display things happening, and goals they want to achieve. As the result, we understood that we have to redesign Resource and Gantt Charts completely. In this release we present the beta version of new Resource Chart. Take a look at Resource Chart and Resource Chart with Time Tracking in the Gallery. Learn more about Resource Chart and Resource Chart with Time Tracking. |
 |
Calendar Support One of the main features of the new Resource Chart is the ability to set the calendar for all resources or some of them. You can configure weekends, holidays, time of availability, beginning of a calendar year, and so on. Learn more about the Calendar>> |
 |
Smart Timeline New Resource Chart features the improved timeline that looks nice with any data. This new Smart Timeline will be made interactive and available in Gantt Charts in the next update. Learn more about the Smart Timeline >> |
AnyChart version history: https://www.anychart.com/products/anychart/history/
AnyStock version history: https://www.anychart.com/products/anystock/history/
AnyMap version history: https://www.anychart.com/products/anymap/history/
AnyGantt version history: https://www.anychart.com/products/anygantt/history/
Trial download: https://www.anychart.com/download/
- Categories: AnyChart charting component, AnyGantt, AnyMap, AnyStock, HTML5, JavaScript, News, Stock charts
- 1 Comment »
Web Analytics Dashboard – Made With JS Maps and Charts Powered by AnyChart
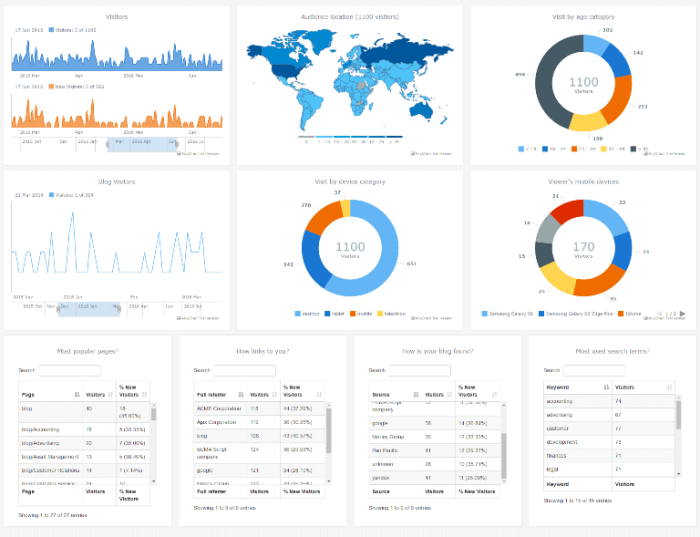
October 19th, 2016 by AnyChart TeamIn today’s world of data, a well-designed web analytics dashboard is a must-have for everyone who is managing a website, a web app, or a number of various web projects. You get tons of statistics about traffic, and you should make them work and help you make right decisions.
How much traffic are you getting? Who are your visitors? Where are they coming from? And maybe even most important – is your marketing strategy working well? It gets much easier and takes significantly less time to answer all these questions when the data is visualized. Here comes an interactive analytics dashboard that allows you to have your data organized, see everything at-a-glance, and pay sufficient attention to all metrics that are important to you.
First-class dashboarding experience is one of the biggest advantages of our interactive data visualization solutions. JavaScript graphs, maps, and stock charts powered by AnyChart can be easily put on a single, effective, interactive HTML5 dashboard, making your traffic data analytics even more powerful and insightful. And here is another great example – Web Audience Dashboard, freshly made by the team of AnyChart for your inspiration.
Look at this:

(large image / interactive version)
And now we definitely should take note of some composition and development features of this dashboard.
- Categories: AnyChart charting component, AnyMap, Business Intelligence, Dashboards, HTML5, JavaScript, Tips and tricks
- No Comments »