AnyChart Open-Sources Powerful, Draw-Anything JS Graphics Library GraphicsJS
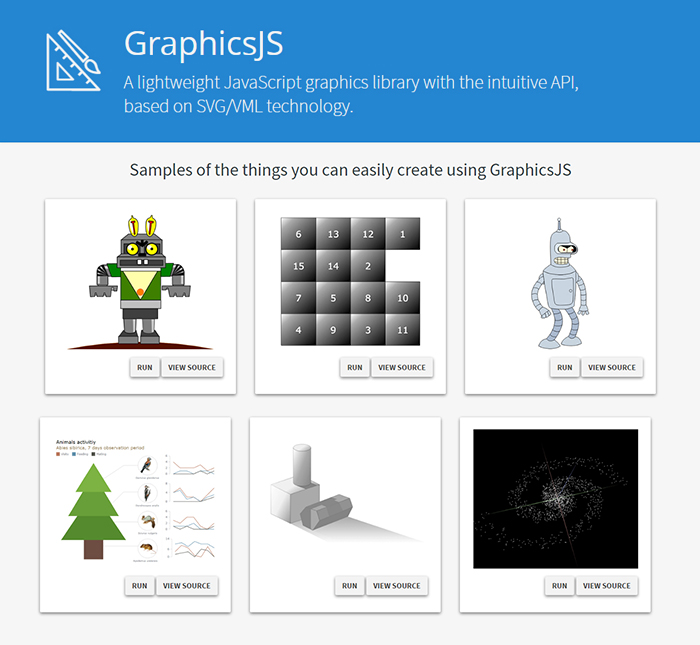
September 15th, 2016 by AnyChart TeamIt is a pleasure for us to announce this today! We have just launched GraphicsJS, a free, open-source, lightweight JavaScript library which allows you to draw any JS graphics and animation for your HTML5 projects very easily. It is significantly more powerful and feature-rich than Raphaël, BonsaiJS, and other formerly leading SVG/VML graphics solutions.
GraphicsJS has always been the graphics engine that our JavaScript (HTML5) charting libraries are built on – AnyChart, AnyStock, AnyGantt, and AnyMap. As a result, it already powers data visualization activities for many of you – Oracle, Microsoft, Volkswagen, AT&T, Samsung, BP, Bosch, Merck, Reuters, Bank of China, Lockheed Martin, and thousands of all the other highly respected AnyChart’s customers including more than 70% of Fortune 1000 companies.
Of course, data visualization is not the only but just one of multiple fields where the library of GraphicsJS can be helpful and even essential. Generally speaking, this solution can help you produce virtually anything graphical from scratch: static and animated images, cartoons, games, interactive infographics, mind maps, and many other amazing things in HTML5.
Key Features of JS Graphics Library
- Mighty line drawing abilities – Bézier curves, arcs, rectangles, and many other kinds of forms and deformations.
- Powerful text manipulation features – multiline texts, measurement, including width, height, as well as wrap, overflow, indent, spacing, align, etc.
- Virtual DOM for drawing fast and only what is necessary.
- Smart layering system with z-index.
- Transformation engine – embarrassing in-browser transformations are not used.
- Legacy browser support (Internet Explorer 6+).
- Concise and convenient JavaScript API with chaining support.
By the way, making our graphics engine open-source is just the beginning as – we are also pleased to tell you – AnyChart is going to open the source code of our charting libraries soon! We believe that our great developments in the fields of graphics and data visualization should be even more visible and reachable to any programmer from any part of the world, not to mention that we would love to allow the community to contribute.
Please refer to GraphicsJS.org to learn more about GraphicsJS. As always, the demos are available on our Playground (Graphics section). Also, let’s not forget about the Graphics Documentation and Graphics API Reference.
What’s more, the GraphicsJS library and all relevant samples can be freely downloaded and forked on GitHub.
- Categories: AnyChart charting component, AnyGantt, AnyMap, AnyStock, Charts and Art, Dashboards, Financial charts, Gantt Chart, GraphicsJS, GraphJam, HTML5, JavaScript, News, Stock charts, Third-party developers, Tips and tricks, Uncategorized
- 5 Comments »
AnyChart Charting Library 7.11.1 Available
September 2nd, 2016 by Margaret SkomorokhA hotfix for AnyChart charting library is now available: we have released AnyChart, AnyMap, AnyGantt, and AnyStock 7.11.1. Here is a full list of improvements and bug fixes:
All Products
Improvements
- Legend width/height behavior improved.
- Scatter Series behaviour made consistent with other series.
- Credits behaviour improved.
- The appendTheme() method added for easier management of themes.
- Beta version of the Data Adapter Module added for easier management of external files.
- Export Server can now return images as base64 strings or as shareable links.
Bug Fixes
- XML Schema validity problems fixed.
- Various minor Export Server issues fixed.
- Various minor Interactivity issues fixed.
- Inconsistent zIndex behaviour fixed.
- Various XML serialization/deserialization fixed.
- Various JSON serialization/deserialization fixed.
- The toXML() deserialization method no longer adds unnecessary data into XML.
AnyChart
Improvements
- Circular Gauge Ranges and Axis Bar can now be properly rounded.
Bug Fixes
- Pie events fixed.
- Funnel Chart label placement algorithm fixed.
- Series on/off problems fixed.
- 3D Chart events fixed.
- Context Menu in Linear Gauges fixed.
- Series Legend Interactivity issues fixed.
- Seat Map labels fixed.
- Legend Interactivity issues fixed.
- Issues with Ordinal Axis Labels fixed.
- Circular Gauge Gradient display issues fixed.
- Tree Map coloring issues fixed.
- Range Marker issues fixed.
AnyMap
Bug Fixes
- The remove() method problems fixed.
AnyGantt
Bug Fixes
- Problems with inheritance of PERT Chart settings fixed.
- PERT Chart export CSV issues fixed.
AnyStock
Improvements
- Overall Performance improved, especially in Firefox.
AnyChart version history: https://www.anychart.com/products/anychart/history/
AnyMap version history: https://www.anychart.com/products/anymap/history/
AnyGantt version history: https://www.anychart.com/products/anygantt/history/
AnyStock version history: https://www.anychart.com/products/anystock/history/
Trial download of AnyChart charting library: https://www.anychart.com/download/
- Categories: AnyChart charting component, AnyGantt, AnyMap, Financial charts, Gantt Chart, HTML5, JavaScript, News, Stock charts
- No Comments »
HR Dashboard – Built With AnyChart JavaScript (HTML5) Charts Library
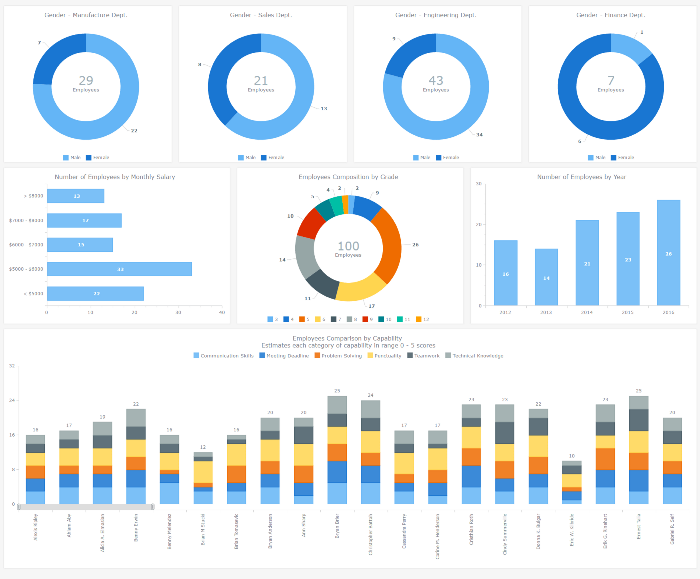
September 1st, 2016 by AnyChart TeamAn HR dashboard is a powerful BI solution that can mightily facilitate making right, data-driven decisions about the workforce in your company – from recruiting and training courses to compensations and job promotions. Smart visualization of all relevant staff-related data, with all charts and graphs on a single page, allows your Human Resources Department to see various metrics at-a-glance. As a result, HR managers are given the power to easily identify trends, outliers, and relationships when it comes to reports and data analysis, and to make sure each decision is well-timed and will drive even more success for your enterprise.
After all, it is the employees that are the most valuable asset.
To inspire and show you how easy it gets to implement this approach with the help of AnyChart JS Charts library, we added an interactive JavaScript-based Human Resources Dashboard to the Business Solutions section of our website as a new HTML5 business dashboard sample with the full source code. It nicely visualizes various employee related data, including demographics, payrolls, performance measurements, and so on. Of course, you are welcome to fork this sample and use our HR Dashboard fully or partially to create your own solution.
Now let’s have a closer look at this interactive HTML5 dashboard, including its composition and some peculiar features. Read more »
- Categories: AnyChart charting component, Business Intelligence, Dashboards, HTML5, JavaScript, News
- No Comments »

