This week we have posted on AnyChart Facebook Page and in Twitter some beautiful data visualizations and related information; we have also shared AnyChart HTML5 Radar Chart. If you have missed the posts, you can read this recap:
- EU referendum: full results and analysis (by The Guardian) – Britain has voted by a substantial margin to leave the European Union. The picture that is emerging is of a heavily polarised country, with remain areas coming in more strongly for remain than expected, and leave areas more strongly for leave. Scotland and London have voted overwhelmingly for remain, but outside the capital, every English region had a majority for leave.
- What happens in an anxious brain? How do we learn? How to stop being afraid of dogs? Neuroscience answers all these questions. Neurotic Neurons is nice interactive animation about neurons and anxiety (a part of the Explorable Explanations project). It explains the concept of exposure therapy, which is used in Cognitive Behavioral Therapy.
- Who needs genres when there is data? Decibels & Decimals is a collection of beautiful data visualizations and thoughts about the modern music environment. This project by Brady Fowler, a graduate of Georgetown University, aims to bring data-driven thinking to extract trends in music sharing, creation, performance and reception.
- Du Hast – Rammstein’s Du Hast: a programmer’s version (misheard lyrics).
-
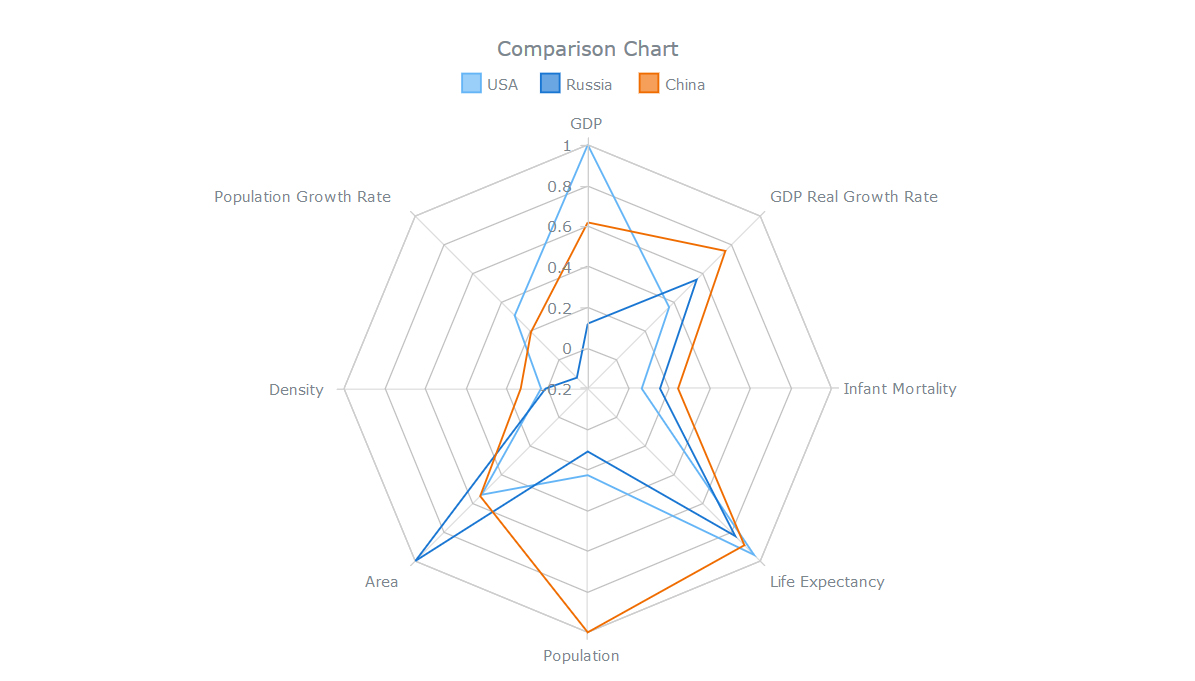
AnyChart HTML5 Radar Chart – This interactive chart compares 3 countries by 8 criteria, helping to see each country’s strong points. It is an example of how you can use a Radar chart (also known as web chart, spider chart, star chart, cobweb chart, star plot, irregular polygon, or kiviat diagram) – a graphical method of displaying multivariate data in the form of a two-dimensional chart of three or more quantitative variables represented on axes starting from the same point.
- Categories: AnyChart charting component, HTML5, JavaScript, News
- No Comments »
