JS Candlestick Chart by AnyStock and More
June 28th, 2016 by Margaret SkomorokhLast week we have shared with you on AnyChart Facebook Page and in Twitter the following data visualizations (including a JS Candlestick chart by AnyStock):
- Explore the world with Tim Peake – Use this map to explore ESA astronaut Tim Peake’s stunning photos of Earth, taken from the International Space Station during his six month mission (created by Esri UK). You will find photos of London, Ethiopia, New Orleans, and many other places, all of them looking great from space!
- ThermalPlot – Multi-attribute time-series data plays a vital role in many different domains. An important task when making sense of such data is to provide users with an overview to identify items that show an interesting development over time. However, this is not well supported by existing visualization techniques. ThermalPlot is a technique allowing to visualize multi-attribute time-series data using a thermal metaphor, which helps users to find items that are important (Team: Johannes Kepler Universität, St. Pölten University of Applied Sciences).
- Understanding Millenial Moviegoers – This infographic by the theatrical analytics company Movio reveals the truth about millennial moviegoing. There are some bad news for art-house and indie filmmakers hoping to get young people into the theater: according to these data, the younger millennials are 45% less inclined to see a drama and 52% less interested in an indie film.
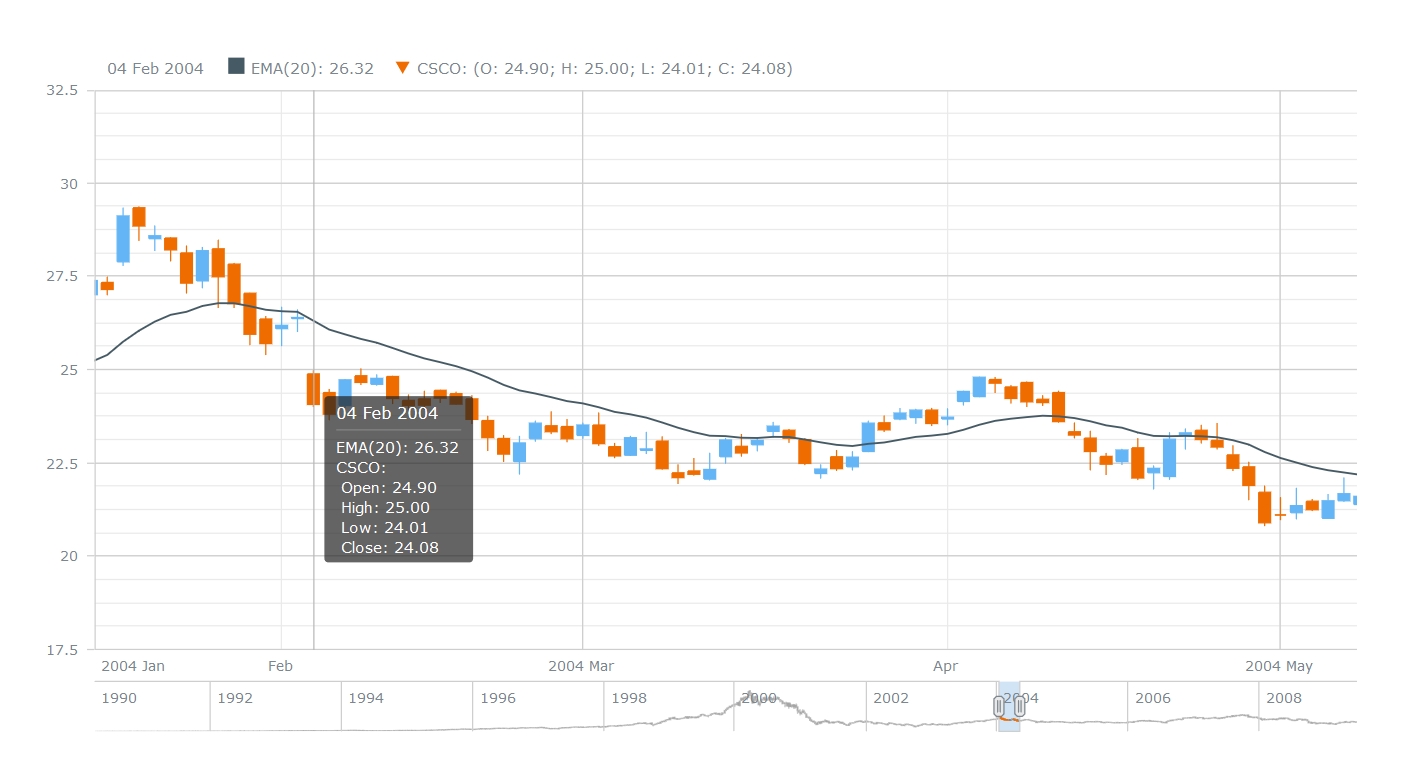
- JS Candlestick Chart by AnyStock – A Japanese Candlestick chart is a combination of a line chart and a bar chart used primarily to describe price movements of an equity over time, where each bar represents the range of price movement over a given time interval. It is mostly used in technical analysis of equity and currency price patterns. The interactive Candlestick chart you see here was created using AnyStock – a JavaScript-based financial charting solution by AnyChart.
- Categories: AnyChart charting component, AnyStock, Financial charts, HTML5, JavaScript, News
- No Comments »
Documentation for AnyChart Web Charts: Now Offline
June 17th, 2016 by Margaret Skomorokh
Good news: now you can download documentation for AnyChart web charts and work with it offline, which is a useful option for anyone with a slow Internet connection. To do it, you should go to https://docs.anychart.com, choose AnyChart version in the upper menu, and press the “Download.zip” button to the right of it. You will get the documentation describing the version of your choice.
AnyChart has a great documentation: for the current version (7.10.1), there are more than 140 articles and almost 900 samples, explaining every aspect of our product and demonstrating how to work with it. You can run all the samples both in JSFiddle and in our PlayGround. Also, you can find an even more detailed description of our charting library in AnyChart API. For more samples, see AnyChart Gallery.
- Categories: AnyChart charting component, AnyGantt, AnyMap, HTML5, JavaScript, Stock charts
- No Comments »
AnyChart Charting Library 7.11.0 Coming Soon
June 10th, 2016 by Margaret SkomorokhAnyChart Charting library will be updated in July: we are going to release AnyChart, AnyStock, and AnyMap 7.11.0. Here is a preview of this update:
AnyChart 7.11.0 New Features
 |
PERT Chart A PERT Chart is a project management tool used to schedule, organize, and coordinate tasks within a project. PERT stands for Program Evaluation Review Technique – a methodology developed by the U.S. Navy in the 1950s to manage the Polaris submarine missile program. PERT chart is still a very popular tool when dealing with big and complex projects, and when Gantt Charts are not enough. |
 |
Full Accessibility Support (Section 508) Section 508 Amendment to the Rehabilitation Act of 1973 requires US Federal Agencies to make their electronic and information technology accessible to people with disabilities. Today Section 508 compatibility is a de facto standard for screen readers, and to fit this standard, we are adding out-of-the-box Section 508 compatibility as well as an option to customize replacement texts or show chart as a table. |
 |
Linear/Tank/Thermometer Gauge A Linear Gauge is a slider or a wide line that can hold much information and possess a variety of features: it can be either vertical or horizontal; the line can be of any width; you can add a single pointer or multiple pointers to show data values. As to Tank and Thermometer Gauges, they are a popular element of dashboards used for monitoring the environment or hardware facilities. |
 |
Chart Editor UI Creating charts with AnyChart charting library is going to be easier than ever: our Chart Editor UI will allow you to configure your chart in a WYSWIG environment. No programming – you will get what you see. Not only that: Chart Editor UI can be used by developers to generate presets or as a part of an integration solution. |
 |
Async Rendering With the Asynchronous Rendering feature, you will be able to render several charts on a page one by one. This feature improves user experience and makes big HTML dashboards more responsive. |
AnyStock 7.11.0 New Features
 |
Y Scale Mode: Changes/PercentChanges When you use the Y Scale Mode, the Y-axis of your stock chart automatically displays changes in the data. In some cases, it helps users to evaluate the situation and understand its’ dynamics quickly. Changes can be expressed either in numbers or in percent. |
 |
Event Markers Using Event Markers, you can mark an event that took place at a specific moment of time, which can be extremely helpful if you need to draw users’ attention to this event. In financial charts, this feature is used to show Key Developments, Dividends, Splits, Insider Transactions, Analyst Opinion Changes, or any other relevant events. |
 |
Data Point Markers A Data Point Marker is used to mark an important point on a chart (for example, the highest or the lowest point). In our charting library, you can customize the shape, size, and color of Data Point Markers or use your own image as a marker. |
 |
Stock Overlay Drawing Instruments Stock Overlay Drawing Instruments is a set of tools that provides end users with an ability to add drawings to to stock charts. Users will be able to draw such elements as Line Segments, Rays, Trend lines, Vertical Lines, Horizontal Lines, Rectangle, Ellipses, Triangles, Trend Channels, Andrew’s Pitchforks, Fibonacci Fans, Fibonacci Arcs, Fibonacci Retracements, Fibonacci Time Zones, Buy/Sell Signals, Custom Text Labels and so on. |
AnyMap 7.11.0 New Features
 |
Seat Map A Seat Map, also known as a Seating Chart, is a way to visualize how people will sit in a vehicle (airplane, bus, train), movie theater, stadium, or in any area where some event is going to happen. This map type is used on ticket booking websites or seat map information services. |
 |
Ability to Use SVG Images as Geo Data The Ability to Use SVG Images as Geo Data can be helpful for those who need to design very custom maps, including maps of imaginary ares. With this feature, you will be able to create literally any map you want. |
 |
TopoJSON Format Support To enhance the performance of our charting library and make it more flexible, we are adding the support of the TopoJSON format. TopoJSON is an extension to GeoJSON, encoding topology; one of its’ advantages is that maps in TopoJSON have a smaller file size. |
 |
Label Position We continue improving label algorithms in AnyMap: this time label positioning will we improved. We are introducing callout labels for small regions, as well as a special Callout UI control for groups of regions. |
- Categories: AnyChart charting component, AnyMap, AnyStock, HTML5, JavaScript, News
- No Comments »
AnyChart JS Charting Library 7.10.1 Released
June 4th, 2016 by Margaret SkomorokhAnyChart JS charting library has been updated: we have released a hotfix for all our products.
AnyChart, AnyStock, AnyMap, and AnyGantt 7.10.1 contain the following changes:
- Solved compatibility issues between AnyChart UI and other AnyChart products.
- Solved compatibility issues with old versions of ExtJS (3.4 and less).
Also, there are a few other bug fixes:
AnyChart 7.10.1
- Fixed a bug with the scroller and continuous series.
- Fixed a bug with tooltips in the TreeMap Chart.
AnyStock 7.10.1
- Fixed a bug with a single point in Stock Charts.
- Solved issues with EMA/SMA technical indicators.
- Solved issues with the mapAs method being called on an empty data table.
AnyChart version history: https://www.anychart.com/products/anychart/history/
AnyStock version history: https://www.anychart.com/products/anystock/history/
AnyMap version history: https://www.anychart.com/products/anymap/history/
AnyGantt version history: https://www.anychart.com/products/anygantt/history/
Trial download of our products: https://www.anychart.com/download/
- Categories: AnyChart charting component, AnyGantt, AnyMap, AnyStock, HTML5, JavaScript, News
- No Comments »
