How was the science of data visualization born? Maybe like this:

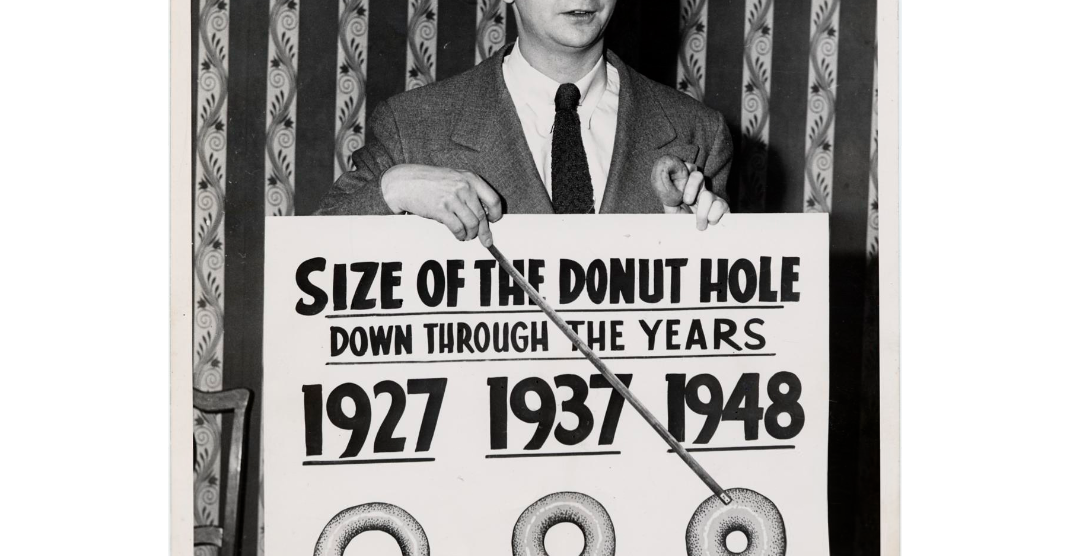
Sally L. Steinberg Collection of Doughnut Ephemera, Archives Center, National Museum of American History
We have no idea what it is and who it is, but this image is a part of Sally L. Steinberg Collection of Doughnut Ephemera of the Smithsonian Institution. You can read about the collection here and here. It includes a lot of nice pieces like this vintage donut-related infographic:

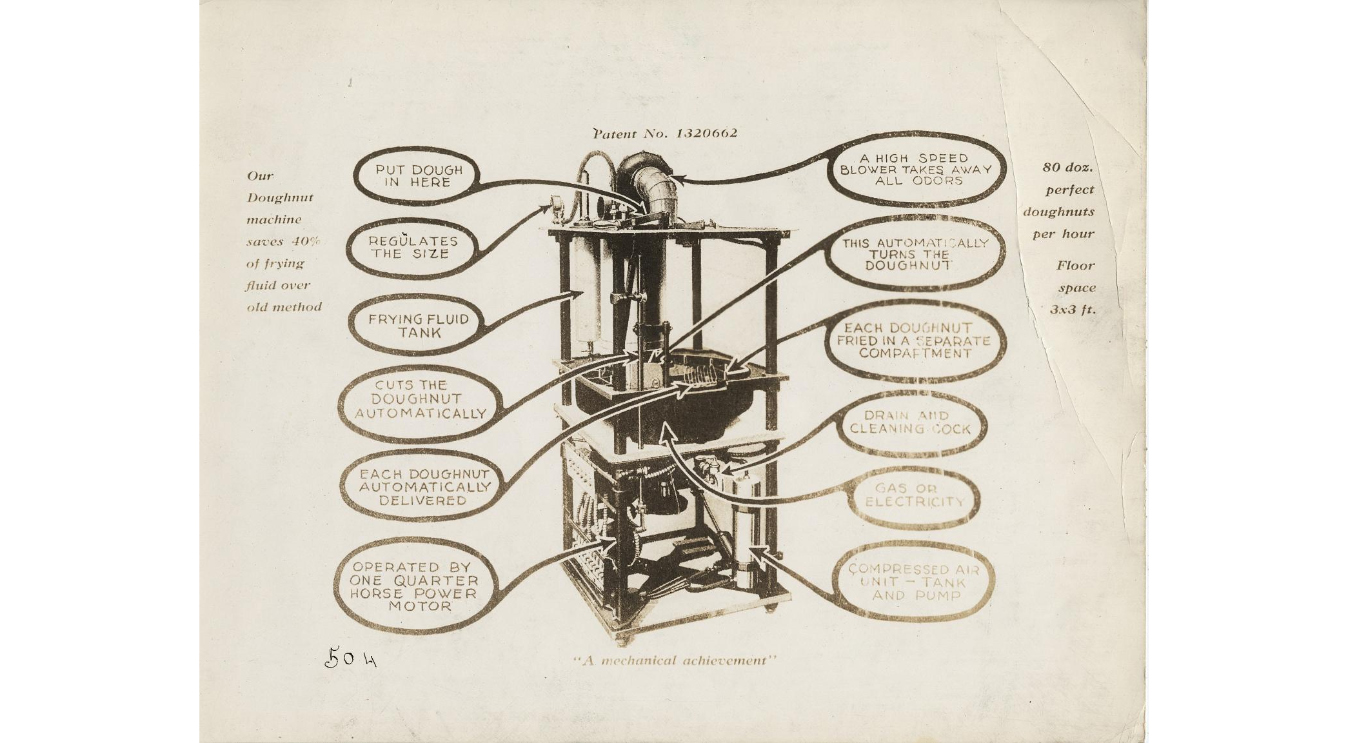
Sally L. Steinberg Collection of Doughnut Ephemera, Archives Center, National Museum of American History
So, does the mysterious chart tell the truth? Has donut hole size really shrunk over the years? It seems that this question is of great public interest! It is thoroughly discussed in this article on Vox.com: Have donut holes gotten smaller? There is also a fierce discussion on Reddit, where one of the participants wisely notes that “1927 was a sad time to be alive”.
However, our customers should not worry: when you work with AnyChart JavaScript donut charts, you can easily configure the size of the hole! Visit our Gallery to see some samples of our donut charts.
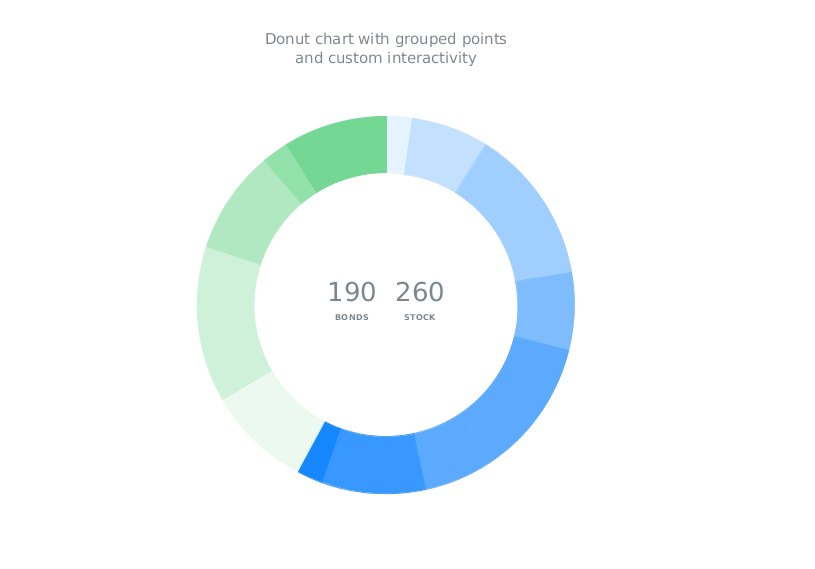
With AnyChart, you can create highly customized interactive donut charts like this one:
This chart was used in our Investment Portfolio Dashboard – we wrote about it earlier: Investment Portfolio Dashboard by AnyChart Charting Framework.
Stay tuned, we have something to say about pie charts too!
- Categories: AnyChart charting component, Charts and Art, HTML5, Humor, Interesting Facts, JavaScript
- 1 Comment »
