Javascript Map by AnyChart
Have you seen the cool data visualizations (including an interactive JavaScript map by AnyChart) that we have shared this week on AnyChart Facebook Page and Twitter? Here is a quick recap of these posts:
- This abolitionist infographic (1788) shows deck plans and cross sections of British slave ship Brookes. It is a strange, unexamined feature of the bicentenary that this image has still served to shape perceptions over two hundred years since its publication. Its continued usage cannot be explained away with traditional assumptions of its ‘innate power’ or ‘effective communication’. Read more about the poster in this article.
- NARKOZ/hacker-scripts – Hate to waste your time on routine tasks like waiting for the coffee-machine to make your latte? Use scripts to hack your life! LOL “The coffee machines uses telnet not SSH!!! this one waits exactly 17 seconds (!), then opens a telnet session to our coffee-machine (we had no frikin idea the coffee machine is on the network, runs linux and has a TCP socket up and running) and sends something like
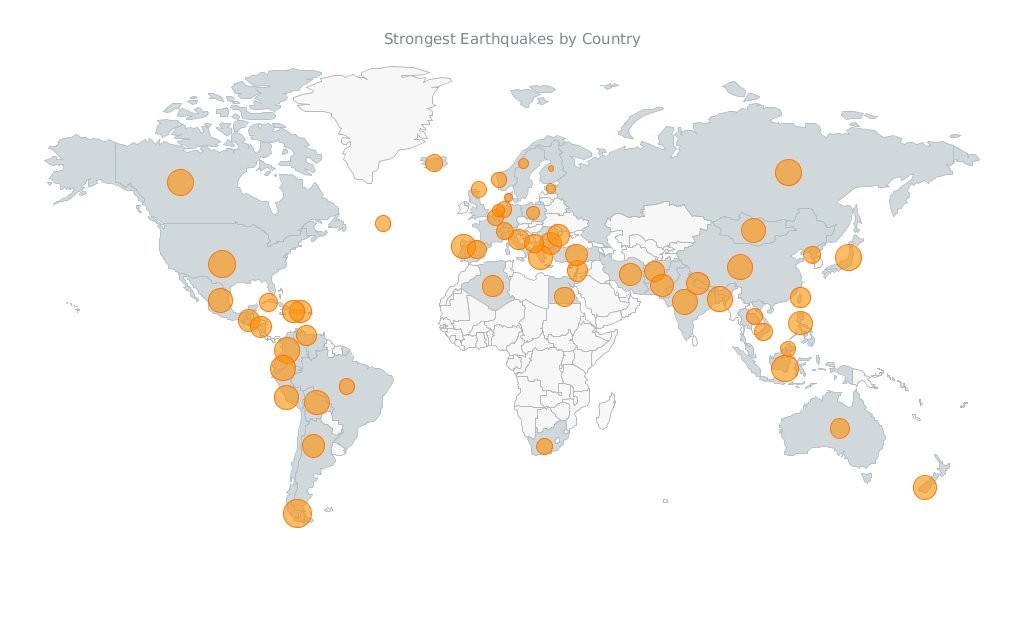
sys brew…” - Bubble Earthquakes Map – Visit our gallery and check out this interactive bubble JavaScript map created with AnyMap. It shows where the world’s strongest earthquakes occurred. AnyMap is ideal for interactive dashboards and side-by-side reporting. This JavaScript mapping solution will help you to build interactive maps and display them in any browser on any platform. AnyMap is useful when you need to display sales by region, election results, population density, or any other information related to a geographic area.
- 15 Years of Terror – a time-lapse of all terrorist attacks with more than 20 fatalities between 1.12.2000 and 13.11.2015.
- Categories: AnyChart charting component, AnyMap, Charts and Art, HTML5, JavaScript, News
- No Comments »