Data visualization is a rapidly growing Internet industry rooted almost in any aspect of our life. As far as visualization is one of the most effective ways of presenting information, every presentation and every information dashboard requires visual information. Moreover, a well-designed dashboard makes any web page look even better, be it a personal blog or website of a big company.
AnyChart is a flexible JavaScript (HTML5) based solution which allows you to create interactive and great-looking charts, dashboards and visualizations. It is cross-browser and cross-platform, intended for everybody who deals with dashboards, reports, analytics and creates statistical, financial, or any other data visualizations. PCs, Macs, iPhones, iPads, Android devices – AnyChart works everywhere, and you will get the same experience across all devices and browsers.
This article highlights the basics of using AnyChart in WordPress – one of the most popular content management systems. You can easily add a dashboard or a chart in your post, making it more appealing and helping your storytelling.
Adding AnyChart to a WordPress Post
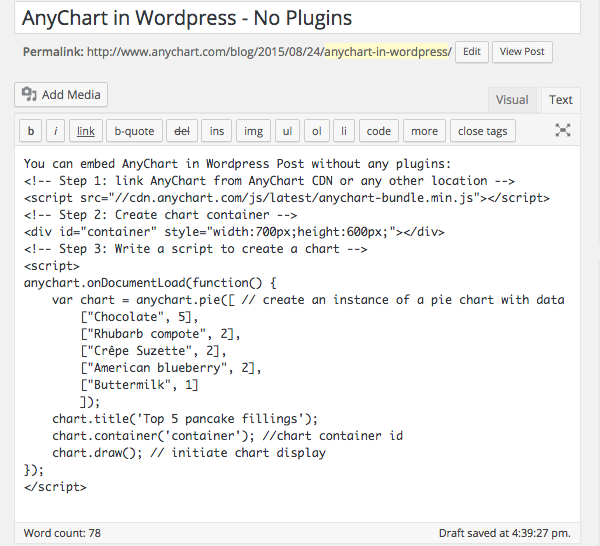
Adding AnyChart to a WordPress post is quite easy. You should open the page editor, switch into Text Editing Mode, insert link to an AnyChart JavaScript file, create a chart container, and add some data and settings, like this:
Note: A chart container may be of any size. However, if there are no style settings for the container and it has zero height and zero width, the chart will be added, but it will not be seen. So do not forget to set container size.
You can open your WordPress blog right now, copy paste the code below and try it yourself:
<!-- Step 1: link AnyChart from AnyChart CDN -->

<script src="//cdn.anychart.com/js/latest/anychart-bundle.min.js"></script>

<!-- Step 2: Create chart container -->

<div id="container" style="width:90%;height:600px;"></div>

<!-- Step 3: Write a script to create a chart -->

<script>

  anychart.onDocumentLoad(function() {

    var chart = anychart.pie([ // create an instance of a pie chart with data

    ["Chocolate", 5],

    ["Crêpe Suzette", 2],

    ["American blueberry", 2],

    ["Buttermilk", 1]

  ]);

  chart.title('Top 5 pancake fillings');

  chart.container('container'); //chart container id

  chart.draw(); // initiate chart display

  });

</script>
That’s basically all you need to to! Could it be easier? Now the page is ready to be published, but do not forget to preview it and make sure that everything looks fine and there are no mistakes in the data.
See below what you get if everything is done right – it actually is a live AnyChart JavaScript Pie Chart which is embedded in AnyChart WordPress Blog the way described above. Hover the slices to see tooltips, click to select them. If you don’t see anything – please check if JavaScript is enabled in your browser.
The <script> tag with data should not contain any empty lines! If there are any, WordPress will replace them with the <p> tag, and the data may be corrupted. Read below to learn how to avoid this.
Disabling Smart Insert
The way of integrating AnyChart from the sample above is quite convenient. But in most cases we may need a little bit more. Just dividing data into paragraphs may help in seeing what is right and what is not, and simple comments are very desirable in some cases. It doesn’t take much to achieve it: WordPress provides you with a number of plugins allowing to disable smart insert (which messes with your code in the first place). You can use, for example, the “Raw HTML” plugin or any other – it doesn’t matter which one you choose. After activating your plugin, wrap the script in the tags specified by the plugin developers (you will need the [raw]…[/raw] tag in case you choose the “Raw HTML” plugin). Then you are free to use any number of empty lines you want and insert comments and notes. It will make no difference in terms of visualization, but it may be of a great help in adjusting and debugging the chart.
Referencing the Script in the Head of a Page
AnyChart.js can be referenced in any part of a page, but we recommend to add the link to the head tag of your blog if you are going to use charts regularly. There are quite a few plugins (like this one) for inserting scripts into the head section, and in some themes you may need to work with wp_head.
Read More
All necessary information about AnyChart can be found in our extensive documentation, API, and Playground.
You can download the component at https://www.anychart.com/download/
Do not hesitate to contact our Support Team or Sales Team if something is still not quite clear.
- Categories: AnyChart charting component, Tips and tricks
- 1 Comment »