Top 5 Books about Data Visualization and Charting
June 30th, 2015 by Anton BaranchukEvery day at AnyChart we deal with a lot of different data visualizations, charts, diagrams, dashboards when we help our clients to build their beautiful products. So, we have a lot of experience with both Flash and HTML5 charts, but also we recognize power of reading to get theoretical understanding of basic concept from guru-thinkers. Here are our top 5 picks: Read more »
- Categories: AnyChart charting component, Books, Business Intelligence, Dashboards, HTML5, JavaScript, Tufte
- No Comments »
AnyChart 7.5.0 and AnyGantt 7.5.0 Released – new version of our HTML5 charts
June 18th, 2015 by Margaret SkomorokhGood news! Today we have two major releases of our HTML5 charts for our customers: AnyChart 7.5.0 and AnyGantt 7.5.0. In the new versions of our components, you will find the Funnel and Pyramid chart types, Dashbording Tools, the Printing and Animation options, and other significant improvements. Check them out:
AnyChart 7.5.0 New Features
 |
Dashboarding Tools The purpose of Dashboarding Tools is to provide simple and convenient instruments for building complex Dashboards. In the current release we present the first part of this set: the ability to highlight/hide series and points, using special methods. See API Reference for more details >> |
 |
Printing The new printing method allows you to make a full-page print of a chart or a dashboard. It supports eight paper size formats: US Letter, A0 – A6, and the portrait/landscape switch. Read more about Printing >> |
 |
Animation Most popular charts types – Line, Column, Bar, Area, and so on – are now animated. Animation supports duration settings and start&finish events. Take a look at the Gallery samples >> |
 |
Funnel Charts Funnel charts (also called accumulation charts) show percentage ratio. They are often used to represent different stages in sales process and show the amount of potential revenue for each stage. Read more about Funnel Charts >> Take a look at the Gallery samples >> |
 |
Pyramid Charts Pyramid charts are used to visualize the hierarchical structure of topics, and progressively ordered quantitative data. Read more about Pyramid Charts >> Take a look at the Gallery samples >> |
AnyGantt 7.5.0 New Features
 |
Printing The new printing method allows you to make a full-page print of your chart. It supports eight paper size formats: US Letter, A0 – A6, and the portrait/landscape switch. Read more about Printing >> |
 |
Events Events allow to handle such user actions as rowClick, rowMouseOver, rowMouseMove, etc. with the .listen() and .listenOnce() methods. Using this methods, you can override default chart interactivity. |
 |
XML/JSON/CSV Data Support The XML and JSON formats can be used for data and settings input; CSV can be used for data input. XML and JSON schemas are available. Learn how you can work with data >> |
 |
Summary Tasks Auto-Calculation The actualStart, actualEnd, and progressValue data fields of grouping tasks became optional. If they are missing, auto-calculation is done, based on tasks in the group. Take a look at the Gallery sample >> |
AnyChart version history: https://www.anychart.com/products/anychart/history/
AnyGantt version history: https://www.anychart.com/products/anygantt/history/
Trial download: https://www.anychart.com/download/
- Categories: AnyChart charting component, AnyGantt, Dashboards, Gantt Chart, HTML5, JavaScript, News
- No Comments »
DeviceLock Chooses AnyChart HTML5 charts for Its DLP Security Solution
June 11th, 2015 by Margaret SkomorokhWe are happy to announce that a new customer success story has been added to our site.
 DeviceLock, Inc, established in 1996, is a leading provider of endpoint device/port control and data leak prevention software for business, education and government institutions around the world. The company offers DeviceLock, a policy-based endpoint data leak prevention (DLP) security solution that enables network administrators to centrally control uploading and downloading activity through local computer devices and network protocols and applications.
The challenge was:
- To present the activity of DeviceLock in a clear and visually appealing way.
- To make complex data easy to read and understand so that the situation could be quickly evaluated by the end user.
Solution:
- AnyChart JavaScript charts were chosen as a solution. The component allows to create stylish interactive HTML5 charts and provides excellent rendering performance.
- Due to wide variety of chart types and the flexibility of AnyChart, it was possible to implement user-friendly data visualizations.
You can enjoy the full success story here:
|
DeviceLock DeviceLock Chooses AnyChart for Its DLP Security Solution >> |
Or see other AnyChart Customer Success Stories.
- Categories: AnyChart charting component, Business Intelligence, HTML5, JavaScript, Success stories
- No Comments »
First Ever Bar Charts Created in 14th Century
June 2nd, 2015 by AnyChart TeamSeveral experts and sources say William Playfair deserves credit for the development of the first bar chart in 1786. However, this statement appears to be misleading, or if not wrong, at least just a part of the truth.
If we get down to the bare facts, one of the greatest thinkers and scientists of the Middle Ages, Nicole Oresme, used a bar chart more than 300 years before Playfair, in his publication titled The Latitude of Forms (14th century). Oresme decided to plot velocity of a constantly accelerating object against time, and here is what he drew:
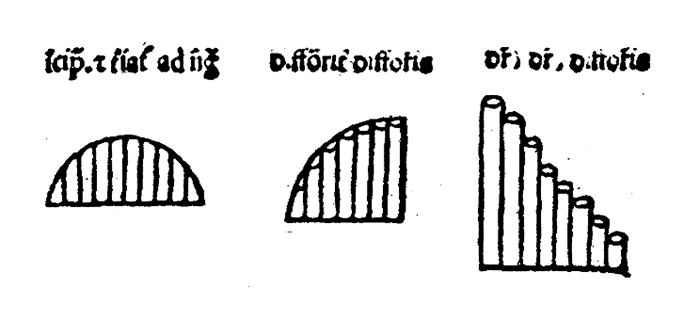
These were the first bar charts in history!
- Categories: Interesting Facts
- 3 Comments »