Today we are glad to publish a new success story – about AnyChart and Meteomedia AG.
 Meteomedia, founded in 1990, is one of the leading weather services in Europe operating its own private weather measurement network and providing detailed data for various weather-dependent industries. The company successfully runs Energy Trading Portal designed for gas and electricity traders as well as energy meteorologists, online Severe Weather Centers in different countries, and other weather portals.
The challenge was to:
- To visualize complex long-range weather forecasts and weather maps for Energy Trading Portal, making it possible for users to compare at a glance different weather models.
- To give users the opportunity to switch quickly between different locations, time ranges, and other parameters.
- To ensure that charts will be easy updatable since new forecast data is added daily or even hourly.
Solution:
- AnyChart solution was used to implement cross-browser and cross-platform animated dashboards visualizing various weather forecasts.
- AnyChart’s interactivity options and ample customization opportunities allowed creating flexible and quickly customizable charts and maps.
- Due to simple XML interface, AnyChart visualizations are very easy to update both manually and via any server-side scripts.
When it comes to making viable forecasts concerning energy price risk and energy demand, weather data is crucial. Temperatures are the key parameter in consumption forecasting. At the same time, the rising energy supply resulting from the availability of renewable energy is increasingly impacting electricity prices, so wind and solar power predictions are also needed. Energy traders are interested both in namely short-term prognoses for the spot market and long-term prognoses for the futures market. And there is no doubt that all these complex data should be clearly and comprehensively visualized.
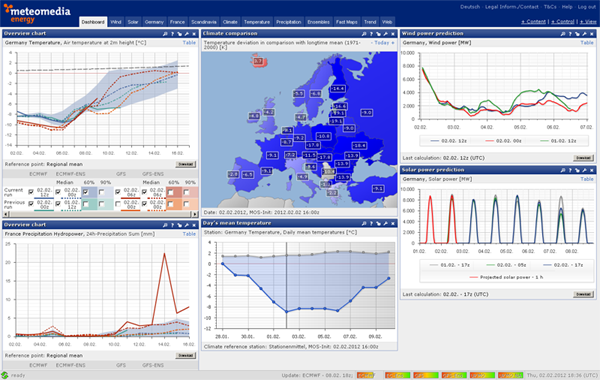
Meteomedia Energy Trading Portal offers advanced customizable charts and maps of different types (line, range area, bar, and color-coded maps) created via AnyChart engine. They are conveniently grouped in dashboards to provide users with the opportunity to compare various forecasts, e.g. related to the same country. It is possible to add and delete charts as well as to select for each of them a particular time range, location, forecast type, and some other parameters.
The following data is visualized in Meteomedia Energy Trading Portal using AnyChart Charts and Maps:
- Overview charts and ensemble evaluations: air temperature at 2m height, temperature 850 hPa level, 24h-precipitation sum, wind speed mean, probability of general weather situation.
- Map of Europe, climate comparison: temperature deviation in comparison with longtime mean.
- Daily temperatures mean, solar power prediction, wind power prediction, wind power model comparison, precipitation totals.
Alongside with that, AnyChart was used to visualize forecasts for online Severe Weather Centers, which are available to the general public: Temperatures, Precipitation, Sunshine duration, Wind, Wind direction, and Humidity.
Take a look at the sample dashboard from the Energy Trading Portal (click it to view a larger image):

This case clearly shows that AnyChart solution has application in weather forecasting industry and can be succesfully used in other systems.
You can enjoy the full success story here: Meteomedia AG Chooses AnyChart To Visualize Weather Forecasts >>
Or see other AnyChart Customers Success Stories.
- Categories: AnyChart charting component, Success stories
- No Comments »