Data Design Advices by Edward Tufte
June 21st, 2011 by Margaret SkomorokhEdward Rolf Tufte is an American statistician and professor emeritus of political science, statistics, and computer science at Yale University. He is noted for his writings on information design and as a pioneer in the field of data visualization. Here is his website: http://www.edwardtufte.com/tufte/.
We appreciate his works very much, especially The Visual Display Of Quantitative Information, which we recommend to any developers or designers.
As it says,
Graphical displays should
- show the data
- induce the viewer to think about the substance rather than about methodology, graphic design, the technology of graphic production, or something else
- avoid distorting what the data have to say
- present many numbers in a small space
- make large data sets coherent
- encourage the eye to compare different pieces of data
- reveal the data at several levels of detail, from a broad overview to the fine structure
- serve a reasonably clear purpose: description, exploration, tabulation, or decoration
- be closely integrated with the statistical and verbal descriptions of a data set.
AnyChart is an instrument. We give the opportunity to create many different charts in many different ways, and this powerful instrument should be used correctly.
Speaking of “encouraging the eye to compare different pieces of data”: compare a table and a graphical representation of the famous Anscombe’s Quartet:
| I | II | III | IV | ||||
|---|---|---|---|---|---|---|---|
| x | y | x | y | x | y | x | y |
| 10.0 | 8.04 | 10.0 | 9.14 | 10.0 | 7.46 | 8.0 | 6.58 |
| 8.0 | 6.95 | 8.0 | 8.14 | 8.0 | 6.77 | 8.0 | 5.76 |
| 13.0 | 7.58 | 13.0 | 8.74 | 13.0 | 12.74 | 8.0 | 7.71 |
| 9.0 | 8.81 | 9.0 | 8.77 | 9.0 | 7.11 | 8.0 | 8.84 |
| 11.0 | 8.33 | 11.0 | 9.26 | 11.0 | 7.81 | 8.0 | 8.47 |
| 14.0 | 9.96 | 14.0 | 8.10 | 14.0 | 8.84 | 8.0 | 7.04 |
| 6.0 | 7.24 | 6.0 | 6.13 | 6.0 | 6.08 | 8.0 | 5.25 |
| 4.0 | 4.26 | 4.0 | 3.10 | 4.0 | 5.39 | 19.0 | 12.50 |
| 12.0 | 10.84 | 12.0 | 9.13 | 12.0 | 8.15 | 8.0 | 5.56 |
| 7.0 | 4.82 | 7.0 | 7.26 | 7.0 | 6.42 | 8.0 | 7.91 |
| 5.0 | 5.68 | 5.0 | 4.74 | 5.0 | 5.73 | 8.0 | 6.89 |

As you can see, in this case the graphical representation speaks loudly, whilst the table remains silent.
We will go on posting here some important tips from Edward Tufte’s books, but after all, the most helpful thing is just considering carefully the way to visualize your data.
- Categories: AnyChart charting component, Tips and tricks
- No Comments »
Auditr Chooses AnyChart to Visualize Healthcare Data
June 15th, 2011 by Timothy LoginovToday, we are glad to publish a new success story: Auditr have chosen AnyChart to visualize healthcare data.
Auditr (http://www.auditr.com/) is an online, totally web-based service designed specially for hospitals and healthcare organizations. It helps to provide assurance, get early warning of potential problems, and improve performance. With Auditr, users can collect data, report and discuss the results, develop and monitor action plans. Auditr is developed by Internet Learning Ltd, a company that previously built learning management systems used in the field of healthcare.
The challenge was to visualize time-based and statistical data for reports in the form of line, bar, meters and heatmap charts and to make the charts interactive so that an end-user could proceed to more detailed information by clicking a particular point of a chart.
AnyChart was chosen as a solution – the component allows creating a wide variety of fully configurable charts, and all data is easily set in XML format. Using AnyChart’s interactivity options, actions that should be performed when a user clicks a point on a chart were defined.
Enjoy the full story:
| Auditr Auditr Chooses AnyCart to Visualize Healthcare Data >> |
Other stories can be found at: https://www.anychart.com/company/success_stories.php
- Categories: AnyChart charting component, Success stories
- No Comments »
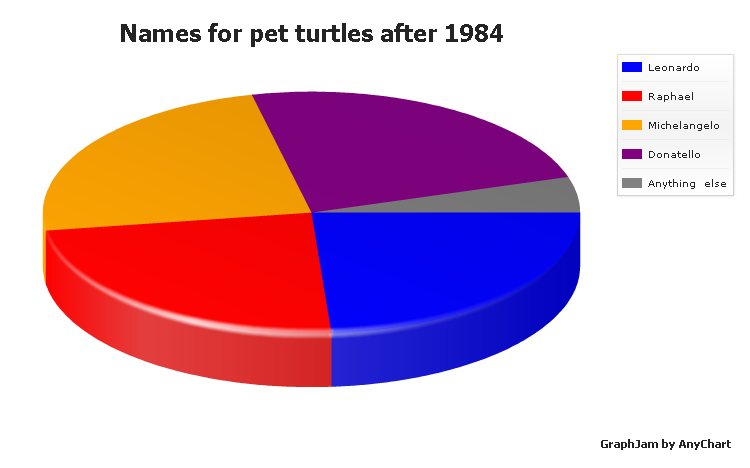
AnyChart GraphJam: Ninja Turtles 3D Pie Chart
June 9th, 2011 by Margaret SkomorokhCharts make people not only understand numbers, but also laugh.
GraphJam is a website showing music and popular culture in funny charts and graphs created by users. These charts can be viewed as a form of modern Internet folklore – signed by nicknames, they are half anonymous, and most witty ones are often reposted by other users in blogs and social networks, which resembles the way folklore spreads.
The fact that charts can be used in such an unexpected and curious way truly inspires us. And it was difficult to stay aside, not trying to apply here AnyChart’s vast capabilities and make some especially interesting items posted at GraphJam even more expressive.
All our charts are fully configurable and nice-looking, so they show the best advantage of any information, including even jokes. One of the many types supported by AnyChart is a 3D Pie Chart, and this is our version of a GraphJam 3D Pie Chart:
To check out other examples of Pie and Donut Charts, visit our gallery.
We will be posting more charts from GraphJam created by AnyChart.
- Categories: AnyChart charting component
- No Comments »
AnyStock 1.2.0 Available
June 2nd, 2011 by Timothy Loginov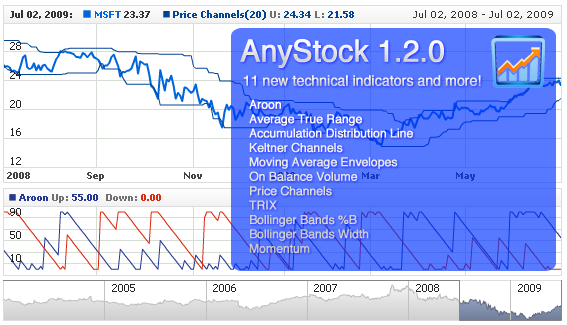
Today we have released a new version of AnyChart Stock and Financial Charts – 1.2.0.
The following new features are available:
- It is now possible to set a time offset in hours for annotation anchor points in the same way it is done for data points or event marker anchors.
- Two new events have been added that allow tracking the beginning and the end of editing annotations.
- Eleven new technical indicators have been added: Aroon, Average True Range (ATR), Accumulation Distribution Line (ADL), Keltner Channels, Moving Average Envelopes (MA Envelopes), On Balance Volume (OBV), Price Channels, TRIX, Bollinger Bands %B, Bollinger Bands Width, Momentum.
Bug fixes:
- The SWC library showed a wrong info in the VERSION constant. This bug has been fixed.
- The error reporting system now works correctly when errors in defining timestamps formats for data sets or data providers are encountered.
Demos and Help Materials updates:
- onAnnotationEditingStart() and onAnnotationEditingFinish() sample handlers have been added.
- The description of new technical indicators has been added.
Full version changes information: http://6.anychart.com/products/anystock7/history/
The roadmap for the next version: http://6.anychart.com/products/anystock7/roadmap/
Download the latest version: https://www.anychart.com/download/
- Categories: AnyStock
- No Comments »