Interactive Flash Map of Brazil with all States
March 20th, 2008 by Timothy LoginovGood news for AnyChart customers from Brazil – today we have published maps of all states of Brazil.
Interesting facts are that back in XVI century the current territory of Brazil was divided into Captaincies, which are a historical administrative divisions of the former Spanish and Portuguese colonial empires. Each one was governed by a captain general.
In the Portuguese Empire, captaincies (capitanias, in Portuguese) were the administrative divisions and hereditary fiefs of the Portuguese state in some of its colonies.
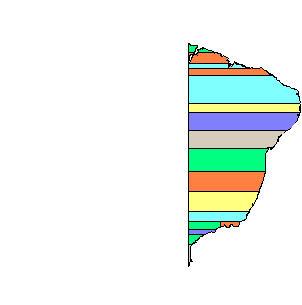
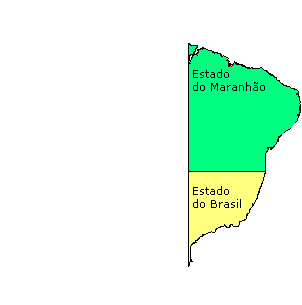
Portugal Empire leaders didn’t think a lot about regional divisions and in 1534 Hereditary Captaincies maps looked like straight stripes of variable height of land, divided parallel to the Equator from the coast to the Tordesilhas Line, created by King John III of Portugal in 1534. Nice map, isn’t it? But this didn’t last long, and in 1573 only Two Viceroyalties were formed:
Since that time many things have happened and Brazil administrative maps were changed several time. The last reform have happened in 1990.
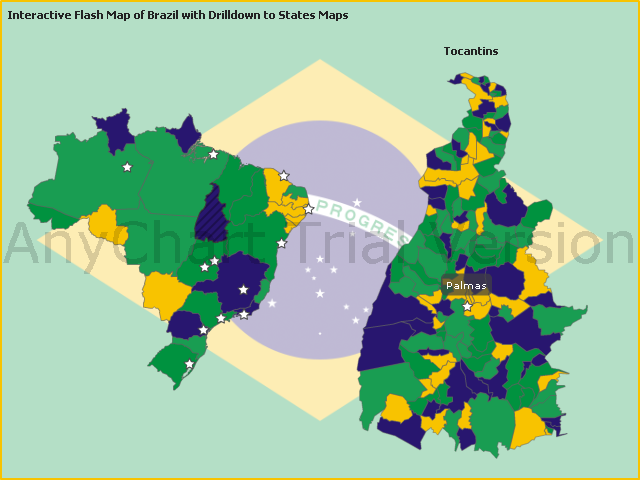
You can look at that map and map of all states in the following interactive flash dashboard created with AnyChart Flash Chart and Map Technology:
Click to view map of Brazil and all its states
So, now you can create Drilldown Maps, Geographical Related Dashboards, Real Estate, Distributor, Franchise, Dealer, locators, statistical or reporting applications etc. – for Brazil Market.
All you need are AnyChart Flash Maps and Sample Source Code from Brazil Flash Map Sample.
P.S.
By the way – Internet usage in Brazil has increased greatly in the last few years and in September 2007 was estimated in 42,600,000 people by ITU (International Telecommunications Union), and a 22.4 % penetration rate, and 6,417,000 of users are Broadband subscribers (June/07, per Teleco) with 3.4% penetration rate.
Brazil is the seventh country in Internet usage in the world.
Historical Maps of Brasil are obtained from Wikipedia
- Categories: AnyChart charting component
- No Comments »
AnyChart Launches Charts for SharePoint
March 7th, 2008 by Anton BaranchukAnyChart for SharePoint beta is available now. It is a charting component designed specifically for Microsoft’s SharePoint portal technology. This web part allows you to create different charts based on SharePoint list data. This product doesn’t require installing any code to the server. AnyChart Flash charting technology is used as the charting engine.
Using AnyChart for SharePoint you can easily build and configure any dashboard in minutes. This solution intended for everybody who deals with creation of dashboard, reporting, analytics, statistical, financial or any other data visualization solutions.
Product page: http://6.anychart.com/products/sharepoint/overview/
Download beta: http://6.anychart.com/products/sharepoint/download/
Installation tutorial: http://6.anychart.com/products/sharepoint/demos/installation.php
Live demo: http://www.SharePointCharting.com/
- Categories: AnyChart charting component
- No Comments »