Creating custom design-time preview for Flex 3 components
February 29th, 2008 by Alex BatsuevSometimes it is necessary to create custom preview of the component in the Flex Builder “Design” view.
It is undocumented feature 😉
I’ve found very interesting class in the Flex SDK 3: mx.core.UIComponentGlobals.
This class contains static field designMode:Boolean.
Just check that field in your component code.
You can download example component with the source code from here:
http://6.anychart.com/tips_and_tricks/designMode/DesignModeComponent.zip
Also you can download the usage sample:
http://6.anychart.com/tips_and_tricks/designMode/DesignModeComponentSample.zip
Running in the Flex Builder “Design” mode it shows AnyChart image. But when it runs in the flash player it shows only gray rectangle.
- Categories: Tips and tricks
- No Comments »
AnyChart for Adobe Flex 3 – advanced chart and map component
February 29th, 2008 by Alex BatsuevAnyChart component for Adobe Flex 3 is now available!
Now Flex developers have better alternative of Flex Charting for adding interactive charts, maps and diagrams into their applications. Our solution allows to build dashboard, reporting, analytical, statistical, financial or any other data visualization solutions with Adobe Flex 3. AnyChart is an advanced Flash based data-visualizataion solution, allowing everyone to utilize power of animation and ultimate interactivity.
It’s just a beta 1 version and we are open for your opinions and suggestions.
You can send them as a comments to this post or contact us directly (support@anychart.com).
You can download SWC library from here:
http://6.anychart.com/products/anychart/docs/platforms/flex/AnyChartTrialSWCComponents.zip
And please take a look at the following samples:
Sample #1: Chart types.
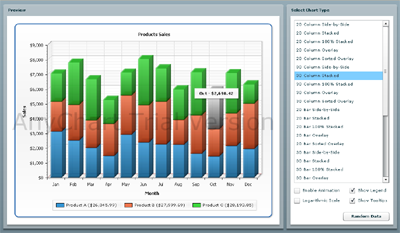
http://6.anychart.com/platforms/flex/samples/chartTypes/AnyChartFlexChartTypes.html
Source code of this sample is available here:
http://6.anychart.com/platforms/flex/samples/chartTypes/srcview/index.html
Sample #2: Sales map.
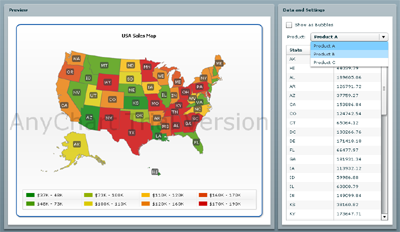
http://6.anychart.com/platforms/flex/samples/salesMap/AnyChartFlexSalesMap.html
Source code of this sample is available here:
http://6.anychart.com/platforms/flex/samples/salesMap/srcview/index.html
Sample #3: Yahoo Weather with AnyChart Flash Maps.
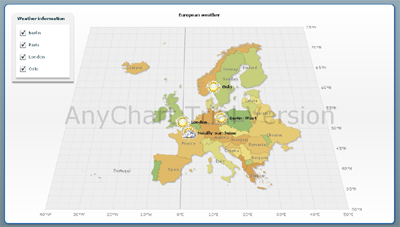
http://6.anychart.com/platforms/flex/samples/yahooWeather/YahooWeatherSample.html
Source code of this sample is available here:
http://6.anychart.com/platforms/flex/samples/yahooWeather/srcview/index.html
Quick start guide:
1. Download AnyChartFlexComponent.swc and add them to the “libs” folder of your project
2. Open your Flex application in the “Design” view.
3. Drag AnyCharFlex from Components panel to the stage (Custom->AnyChartFlex)
4. Open the “Code” view and write XML for the chart. e.g.
<ns1:AnyChartFlex x="10" y="10" width="550" height="400">
<ns1:anychartXML>
<mx:XML>
<anychart>
  <charts>
    <chart>
      <data>
        <series>
          <point name="pt1" y="10" />
          <point name="pt2" y="20" />
          <point name="pt3" y="30" />
          <point name="pt4" y="40" />
          <point name="pt5" y="20" />
        </series>
      </data>
    </chart>
  </charts>
</anychart>
</mx:XML>
</ns1:anychartXML>
</ns1:AnyChartFlex>
That’s it! Quick and Easy!
You can find complete XML reference here:
http://6.anychart.com/products/anychart/docs/xmlReference/index.html
Beta 1 provides full support of the AnyChart XML format, it means that all AnyChart features are available!
So – you are welcome to play with our demos and leave your comments! Your opinion is very important for us – Thank you!
- Categories: AnyChart charting component
- No Comments »
ActionScript 3 compiler – – bug
February 19th, 2008 by Alex BatsuevWe have found a nice bug in mxmlc compiller 🙂
var a:Number = 10;
var b:Number = 20;
var c:Number = a – – b;
trace (c);
It’s correct! Result is 30. But mxmlc ant task doesn’t compile this code sometimes…
It’s very surprising bug.
- Categories: Uncategorized
- No Comments »
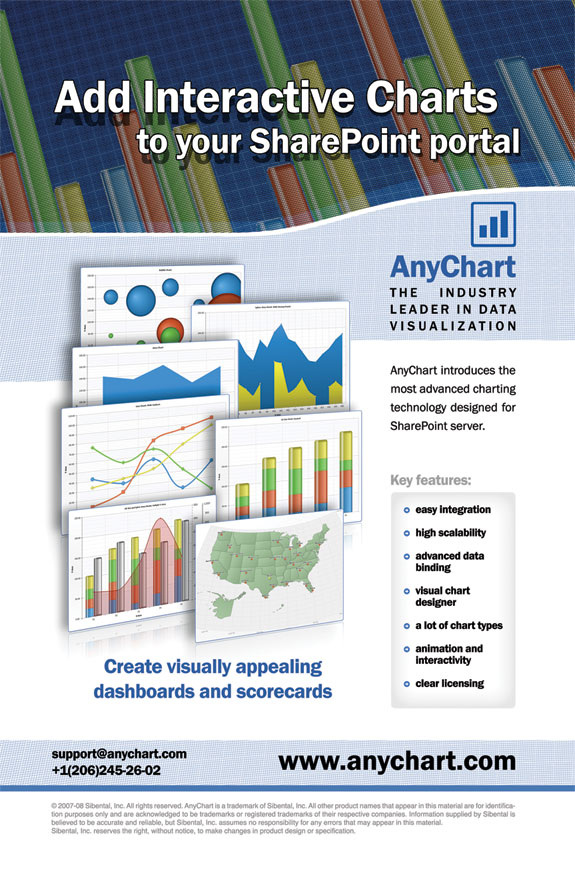
Add Interactive Charts to your Microsoft SharePoint portal
February 4th, 2008 by Anton BaranchukAnyChart announces new product – AnyChart for SharePoint!
That product will add advanced charting functionality to Microsoft SharePoint projects.
Key features:
– easy integration
– high scalability
– advanced data binding
– visual chart designer
– a lot of chart types
– animation and interactivity
– clear licensing
The product will be launched during March’08.
Interested in product? Want to participate in beta-testing program? Please contact us support@anychart.com
Create visually appealing dashboards and scorecards for SharePoint with AnyChart!
- Categories: AnyChart charting component
- No Comments »